Global Journal of Ecology
A trend of "geomagnetic jerks" in the inhibition of the earth's south magnetic pole?
AV Tertyshnikov*
Cite this as
Tertyshnikov AV (2024) A trend of "geomagnetic jerks" in the inhibition of the earth's south magnetic pole?. Glob J Ecol 9(1): 094-100. DOI: 10.17352/gje.000101Copyright
© 2024 Tertyshnikov AV. This is an open-access article distributed under the terms of the Creative Commons Attribution License, which permits unrestricted use, distribution, and reproduction in any medium, provided the original author and source are credited.The possibility of a reversal in the displacement of the Earth's South Magnetic Pole (SMP), the speed of which has decreased threefold over the past 60 years, is being discussed, which does not contradict the theory of “geomagnetic jerks.”
The results of the experiment on measurements of magnetic declination on 6-9.04.2020 in the Southern Ocean are presented. Remote measurements are caused by the fact that during the day the SMP moves along a quasi-closed perimeter with semi-axis sizes up to 50 km. The discrepancies between the magnetic declination measurements and the model isogons of the International Geomagnetic Reference Field (IGRF13) model allow us to estimate the daily average position of the SMP. An example with the estimation of magnetic deviation of ship magnetic declination observations affecting the SMP position determinations is analyzed.
Introduction
Russia has made a significant contribution to the history of the discovery of the Earth's South Magnetic Pole (SMP). In the first Russian Antarctic expedition of 1819-1821, an extraordinary professor of the Kazan University I.M. carried out magnetic observations and determined compass deviations at various ship courses. They were not included in the report of the expedition for the maritime department. Only in 1830, the results of measurements were published in the Kazansky Vestnik. A few years later, K. Gauss saw this article, translated it into German, and in 1840, through I. Kruzenshtern, he requested F. Bellingshausen for the materials of the expedition measurements and calculated the position of the SMP [1,2].
The calculations were confirmed after the return of James Ross from Antarctica, who was given priority in determining the coordinates of the SMP in 1841, although in his expedition he passed 250 km from it [3,4].
The coordinates of the South Magnetic Pole of the Earth (SMP), determined in the expedition of E.G. Shackleton on 15.01.1909, confirmed the displacement of the magnetic pole, which continues to this day (Figure 1).
The North Magnetic Pole of the Earth (NMP) showed a reversal in its movement at the beginning of the last century. The drift direction has changed almost in the opposite direction to the north geographic pole with anomalous acceleration. An abnormally high drift velocity for the NMP was recorded in 2016.
A similar effect is associated with “geomagnetic jerks”, discovered in 1978 and allowed by the theory of geomagnetic dynamo. Jerks are possible due to the surface effects that magnetohydrodynamic waves experience when reaching the core-mantle boundary.
An anomalous deceleration occurs with the SMP motion. The SMP velocity has decreased threefold over the last 60 years, which does not contradict the theory of "geomagnetic jerks". With such a trend, one can expect a reversal in the SMP shift in the next 10 years - 20 years. The current SMP shift rate is estimated to be about 6 km per year. At such low velocities, forecasting errors are also rather critical.
Errors in modeling the position of the magnetic poles, for example, according to the International Geomagnetic Reference Field (IGRF) model [5], are especially noticeable when compared with calculations based on high-precision observations from a network of magnetic observatories and satellite measurements [https://maps.ngdc .noaa.gov/viewers/historical_declination/]. This can be explained by the fact that calculations of the pole position based on data from magnetic observatories [6] are carried out once every 20 years - 30 years. And the models use adjustments every 5 years. Over almost a quarter of a century, models can develop a significant discrepancy with measurement data. The estimation of this discrepancy can also be used to assess the anomalous deceleration of the SMP.
Magnetic poles are a manifestation of the main magnetic field of the Earth, the models of which use the model of a magnetic dipole in the center of the Earth. The axis of the dipole, for example, in the World Magnetic Model (WMM) [7] is inclined approximately 9.41° to the Earth's rotation axis and intersects the Earth's surface at two opposite points called geomagnetic poles. The position of the actual magnetic pole zones, where the magnetic field on the Earth's surface is quasi-vertical, does not coincide with the geomagnetic pole zones.
An additional contribution to the Earth’s magnetic field is made by the anomalous field due to the magnetization of rocks in the Earth’s crust and the external magnetic field formed by currents in the ionosphere and magnetosphere [3,8].
The coordinates of the Earth's Magnetic Poles (EMP) are available in all the models of the Earth's magnetic field, including the commercial British Global Geomagnetic Model (BGGM) [9] of the British Geological Survey, which is actively used by oil and gas companies beyond the North Arctic Circle.
The areas around EMP remain difficult for direct measurements due to complicated hydro-meteorological conditions hindering magnetic surveys with high-precision and expensive equipment. In 1995, the Scientific Committee on Antarctic Research (SCAR) with the support of IAGA (International Association of Geomagnetism and Aeronomy) initiated the Antarctic Digital Magnetic Anomaly MAP Project to create a unified map of magnetic anomalies of Antarctica and the surrounding seas and oceans and to integrate all available ground, airborne, marine, and satellite magnetic data into a digital database. The compiled map of magnetic anomalies is useful as a regional basis for the interpretation of magnetic studies, in detailed studies of magnetic and geological features [10]. At the same time, magnetic anomaly features have been identified in the Dumont-D'Urville Sea in the SMP area [11].
To monitor the EMPs, it is necessary to take into account the fact that their coordinates during the day describe a complex oval. For SMP, the sizes of the semi-axes reach 50 km during magnetic storms, which is significantly larger than the estimates of the annual displacement. The center of the trajectory oval is taken as the position of the EMP.
Remote measurements are used to estimate the position of the EMPs. For example, satellite measurements (CHAMP, Swarm, etc.) [12]. Magnetic ranging tools are actively used in deep well drilling [13,14]. These principles can also be used in the calculation of the EMP's position based on magnetic declination measurements at significant distances from them. This will make it possible to overcome the scale of the phenomenon, as well as the inaccessibility of EMP zones.
Direct hydromagnetic investigations in the designated zone of the SMP using two towed three-component magnetometers with torsion and magnetoresistive sensors are reported in [15] at storm wind speeds up to 30 m/s and waves up to 6 m, and ship speed of 8-12 knots were used for measurements of the anomalous magnetic field by the differential method. When selecting the measurement area, the "artillery fork" method was used - finding the center between the pole coordinates according to IGRF and WMM statistical models for the approximate time of the experiment. It was ignored that the South Pole, in a day, outlines a curve with a large semi-major axis, the size of which reaches the five-year average displacement of the South Pole. The ambitious statements during expeditions and the subsequent leapfrog of authors in the stream of publications about goals, objectives, and research results confirmed their collapse. The first estimates of the position of the South Pole in 2020 were obtained in another experiment.
Scheme of experiment
The experiment on the SMP position estimation was carried out in the first decade of April 2020 according to the data of the Information-Analytical System (IAS) of the ship "Marshal Gelovani". IGRF13 [5] was used as a model basis. Remote measurements of the SMP position allow us to realize the principle "great is seen at a distance", with the SMP zone turning into a point.
The equipment used to obtain the measurement data included the ship's standard GNSS navigation receiver, a gyrocompass oriented to the geographic pole, and a magnetic compass. The accuracy of the gyrocompass and magnetic compass at a considerable distance from the SMP zone turned out to be quite sufficient for the experiment and exceeded the accuracy of the mapped isogons (lines of equal magnetic declination - the difference between the direction of the compass needle and the direction to true north, i.e. along the Earth rotation axis) according to the IGRF model. The discreteness of measurements was 1 hour.
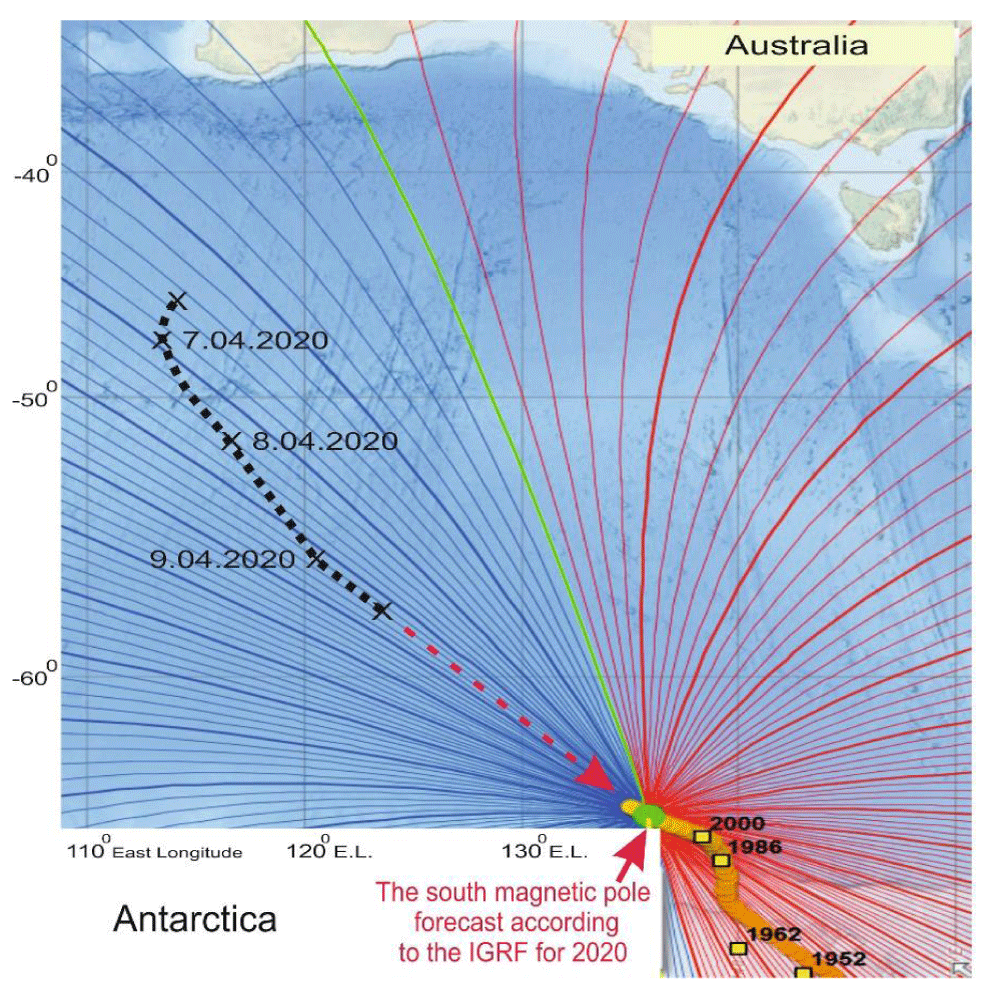
For the observation period from 17:00 Moscow time on 06.04.2020 to 13:00 on 09.04.2020, the route of measurements is presented in Figure 2 in the rectangular projection of coordinates against the background of the isogon fan according to the IGRF13 model for 01.01.2020 under quiet geomagnetic conditions.
The blue isogon indicates the deviation of the model magnetic declination to the north, the red - to the south, and the green line - the boundary between them. The red arrow in the continuation of the measurement route is oriented to the assumed position of the SMP. Yellow squares correspond to the calculated SMP position according to the data of high-precision measurements of magnetic observatories for the indicated year. The orange curve is the result of modeling the SMP displacement using the IGRF13 model.
The difference between magnetic compass and gyrocompass readings at the measurement point with correction for the anomalous magnetic field corresponds to the magnetic pseudodeclination because it does not take into account the magnetic deviation of the vessel, which must be regularly corrected by circulation along the route.
Minimizing the discrepancy between the pseudodeclination and the main magnetic field of the Earth mapped according to the model for different years allows us to estimate the approximate position of the SMP and the quality of the Earth's magnetic field model used. Solving such simple inverse problems for smooth functions is not difficult.
Measurement results
To assess and compensate for the anomalous magnetic field, the models and observational data of the nearest to the route magnetic observatories of the highest quality standard of INTERMAGNET measurements (GNANGARA in southwestern Australia and CANBERRA) were not required. The anomalous magnetic field along the experiment route was insignificant against the background of the main magnetic field, which is confirmed by the data of the WDMAM magnetic anomaly model (World Digital Magnetic Anomaly Map [16]). This model was created as part of an international scientific project under the auspices of IAGA and CGMW (Commission for the Geological Map of the World) to summarize and map the characteristics of magnetic anomalies caused by the earth's lithosphere in continental and oceanic areas around the world. EMAG2 model magnetic anomaly data from [17,18] were also used for comparison. Variations in the anomalous magnetic field along the ship's route in the Southern Ocean according to the model, in fact, according to CHAMP and Swarm satellite data (altitudes 400-450 km), amounted to +/- 150 nT. Coastal magnetic field anomalies near Antarctica according to [19] are estimated at +/- 5 nT.
The conclusion about the small contribution of the horizontal components of the anomalous magnetic field to the compass readings along the experiment route and at a great distance from the SMP is confirmed by the estimate of the contribution of the Earth's internal magnetic field to the full magnetic induction vector (B) observed on the Earth's surface (more than 95% of the total level) near the magnetic poles, where the field vector is oriented quasi-perpendicular to the Earth's surface, with an estimate of about 60000 nT, and in the area of the equator, where the vector is directed horizontally - about 30000 nT. For comparison, in the Norwegian Sea (~65 °N) the magnitude of the full field vector is about 52000 nT, and the horizontal (mainly azimuthal) component of this vector is about 11000 nT. In Alaska (~70 °N), the full vector is equal to 53000 nT, and the azimuthal component is approximately 8000 nT [14].
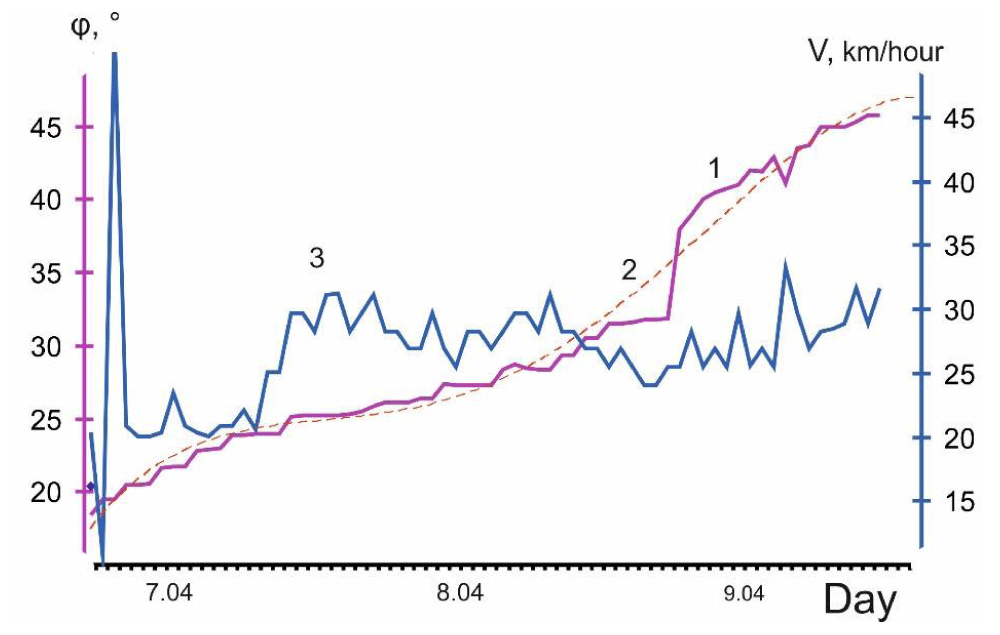
The results of the route measurements deciphering are presented in the graphs in Figure 3.
In determining the velocity by visual navigation measurements, errors due to complicated hydrometeorological conditions were discarded. To verify the measured magnetic declination, an approximating polynomial of degree 4 with a high confidence level R² = 0.9822 was selected in the form: y=-9E-06x4+0.0013x3-0.0596x2+1.1546x+16.35, where x is the number of hour from the beginning of the experiment. On its background, the anomalous changes in magnetic declination on 8.04.2020 were more clearly manifested.
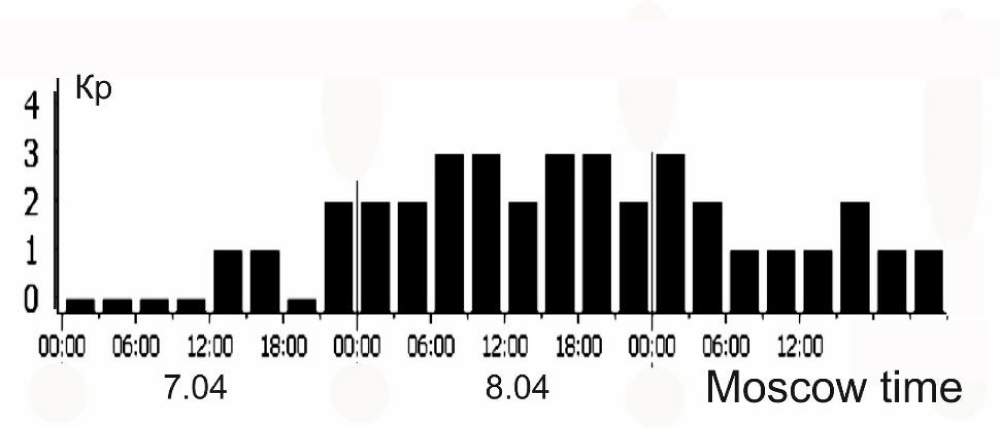
A sharp increase in declination occurred at the end of the day on 8.04.2020 [20]. It did not fit into the dynamics of the estimates of three-hour k-indexes calculated from data of magnetic measurements at the French Antarctic station Dupont-D'Urville, which is located on the coast of Antarctica and closest to the South Antarctic Peninsula Zone. These estimates are presented by Alexey Kalishin's calculations in Table 1.
Data on three-hour k-indices for the Moskva station are presented in Figure 4.
Figure 5 presents the discrepancies of magnetic declination estimates based on the results of ship measurements and the IGRF model for the epochs 2000 and 2020.
Sharp changes in the discrepancies occurred when the ship left the cold front zone. Wind and waves changed. The keel rocking was replaced by a lateral rocking. A strong wave began to hit the ship's side. The height of individual waves reached 8-10 meters (Figure 6). The impact of the anomalous wave caused damage to the ship equipment fasteners and alteration errors. Therefore, after 09.04.2020, the experiment was terminated, since it was impossible to remove the anomalous deviation [21].
Estimates of systematic measurement errors
The magnetic compasses used in the measurements were located on the upper deck and in the pilothouse. The gyrocompass heading estimates corresponded to the course determinations from the navigation receiver data. To assess the possible systematic error of measurements (including magnetic deviation of the ship), we used estimates of magnetic declination discrepancies in the Arctic along the route of the scientific expedition ship "Mikhail Somov" on June 10-30, 2021 [22], where the same measurement scheme was used as in the Southern Ocean [21] and on the ship "Professor Molchanov" in [2].
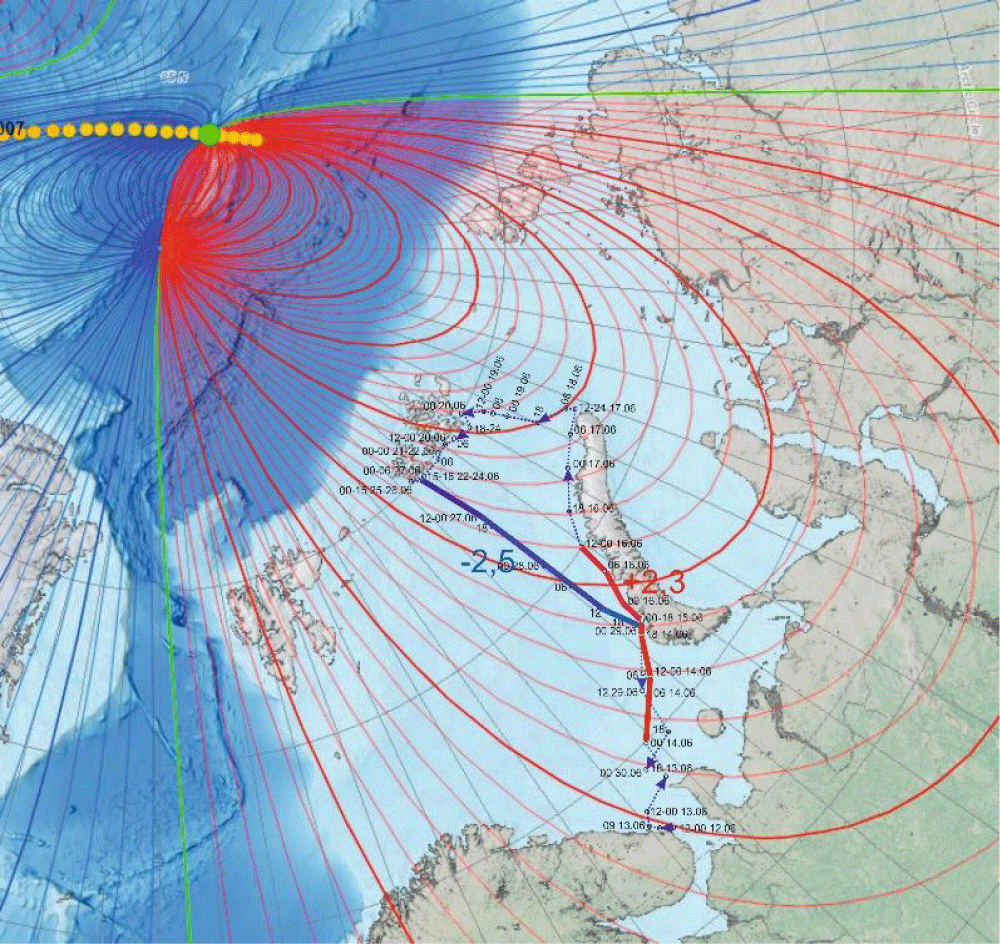
The calculated route of experimental studies of the potential systematic error of magnetic shipboard measurements is presented in Figure 7.
The ship's route is presented against the background of isogons calculated using the IGRF13 model for 01.01.2021, the model annual position of the magnetic pole is shown by yellow and green (as of 01.01.2021) dots. Green lines are zero isogons. The temporal binding of the ship is marked at the route sections. Thick lines on route sections correspond to average anomalous discrepancies - deviations of the calculated magnetic declinations from the model ones by an average of +2.3° (red) and -2.5° (blue). These estimates were obtained by rejecting measured magnetic declinations that differed by at least 5° from the mapped ones. The arrows show the potential displacement of isogons necessary to compensate for the anomalous discrepancies. The obtained estimates of the average anomalous discrepancies can be used in evaluating the results of Figure 5.
The results of Figure 7 can be interpreted as a manifestation of the magnetization of the iron structure of the ship in the external magnetic field of the Earth. If we do not take into account the coastal effect in the Earth's magnetic field near the coast of Novaya Zemlya and the intersection of magnetic field anomalies, to compensate for the magnetic deviation of the ship, the model NMP should be closer to the ship from its true position when traveling northward. The unidirectional poles of the magnets are attracted. On the ship's return trip, the opposite appeared to be true. The ship does not appear to have remagnetized in the external magnetic field. This necessitates the measurement of discrepancies along long closed routes.
Discussion on the pseudo-coordinates of the south magnetic pole
Determining the position of EMPs means working with huge amounts of data under the guidance of experts known in magnetometry, whose authority guarantees the quality of the results. The experience of monitoring the position of EMPs in Russia has been lost [23]. The results of the experiment became the basis for the first in the history of modern Russia's assessment of the SMP position.
The experiment was organized to support the work on determining the position of the SMP by the magnetometer group on "Admiral Vladimirsky", where military meteorologists from "Marshal Gelovani" transmitted the coordinates of the meeting point in the zone of the model position of the SMP according to the IGRF model: as of 01.01.2020. 135.866 E and 64.081 S. [24]. According to the WMM model: 135.877 E and 64.073 S. [25].
This information was passed on to organize the meeting of vessels in the SMP area. Confirmation of receipt of coordinates was received. The "Admiral Vladimirsky" determined the meeting point and course.
The transmission of the coordinates of the north magnetic pole was not provided. According to interviews with the expedition participants, the second vessel did not have pole coordinates. Their receipt from the Marshal Gelovani helped the ships to meet. The "curators" of the magnetometric expedition on Admiral Vladimirsky did not respond to requests.
When discussing the results of the experiment on the "Marshal Gelovani" in the Southern Ocean, one should note the quality of preparation and operation of standard shipboard measuring instruments. It is worth noting the high authority of multiyear results of modeling of the magnetic field by the IGRF model. Therefore, in the experiment it was planned to evaluate the correspondence of measurements to the model data - this is one of the indicators of model quality.
For the measurements from "Marshal Gelovani" in the Southern Ocean, the tendency of increasing the discrepancy between the SMP positions for the epochs of 2000 and 2020 was manifested. This can be due to the overestimation of the displacement rate of the modeled SMP position for 2020. Given the low displacement rates per year, we can limit ourselves to this conclusion, since daily variations in the SMP, as indicated above, vary in the range of up to +/- 5 years.
The position of the SMP for the 2000 epoch is closer to the estimates obtained from magnetic observatory data. Taking into account the correction for the estimate of potential magnetic deviation determined for the ship "Mikhail Somov", one can determine the position of the SMP between the prognostic values for 2000 and 2020 and closer to the latter, which means that changes in the SMP displacement are possible. The problem with the assessment of magnetic deviation could be clarified by measurements from the ship "Admiral Vladimirsky" approaching from the Atlantic. However, participation in the experiment was refused. Joint measurements were not stipulated in the ship's assignment. Ambitions and psychological pressure of the long-distance campaign played their role. The task of determining the coordinates of the SMP stated in the mass media was not fulfilled and gradually disappeared. Two years later the captains of the ships were replaced. The "curators" were traditionally encouraged.
Models of the main magnetic field are statistical. They use data from measurements of ground-based magnetic observatories and special magnetic satellite observations. The IGRF model combines a set of mathematical models of the Earth's Main Magnetic Field and its rate of change and is based on the method of spherical harmonic analysis [5]. Updating of the coefficients in the next version of the IGRF model occurs every 5 years and is approved by the International Association of Geomagnetism and Aeronomy (IAGA). In 2019, IAGA pre-released the 13th version of the IGRF, increasing to 13 the set of coefficients used to calculate the scalar potential V of the main magnetic field at the Earth's surface and above in the spherical coordinate system.
Model coefficients were calculated by the IAGA V-MOD working group. The software implementation of the model is available, as are the simulation results, including the position of the EMPs, where the selection of the envelope of previous coordinates and their extrapolation are used. Extrapolation errors are inevitable and depend on the length of the series used.
The use of WMM [WMM], which presents maps for each of the seven magnetic elements (D, I, H, X, Y, Z, and F) and their secular variations (rates of change), in the calculations turned out to be more difficult in practical terms.
The accuracy of magnetic field calculations over the territory of the Russian Federation at satellite flight altitudes is estimated at 0.5°. The greatest errors in determining the magnetic field occur at high latitudes. According to estimates [26,27], near the Earth’s surface in areas of magnetic anomalies, the declination error can exceed 7° - 10°.
Local anomalous changes in the magnetic field are easily detected by communications equipment and compasses when electric trains are accelerating. At each station, passengers are twice exposed to magnetic disturbances induced by the electric motors of trains, comparable to a strong magnetic storm. The R/V "Mikhail Somov" is a diesel-electric ship. When deciphering the readings of its ship instruments, the influence of ship electric generators under load on the anomalous magnetic deviations were noted. At steady motion, the ship instruments used in the experiment recorded adequate and stable changes.
The measurements could be influenced by a magnetic storm. In the Southern Ocean, this was manifested in small variations of the calculated magnetic declination. During the cruise of the "Mikhail Somov" along the western coast of Novaya Zemlya on 15-16.06.2021, a weak magnetic storm was also recorded. At this time the route passed through a positive anomaly of the magnetic field, which also manifested itself in anomalous systematic errors of the calculated discrepancies.
Negative anomalies of residuals during the return of "Mikhail Somov" from Franz Josef Land to Novaya Zemlya on 06/27 - 29/2021 coincided with the position of the negative anomaly on the map of the anomalous magnetic field according to the EMAG2v3 model [EMAG3], compiled on the basis of satellite, ship, and airborne magnetic measurements. In the Southern Ocean along the experimental route, magnetic field anomalies according to the EMAG2v3 model were insignificant.
One can note the advantage of the technology of magnetic ranging of the position of the Earth’s magnetic poles implemented in the Southern and Arctic oceans. With the help of ship information and analytical systems, air and space measurements. To resolve the issue of the anomalous kinetics of the SMP, we are waiting for an assessment of the position of the SMP based on data from magnetic observatories.
Conclusion
Over the past 60 years, the rate of displacement of the SMP has decreased threefold. At such rates, in accordance with the theory of “geomagnetic jerks”, a reversal in the displacement of the SMP is possible in the next 10-20 years with a subsequent acceleration of the displacement.
The position of the pseudo-position of the SMP according to measurements of magnetic declinations in the Southern Ocean, taking into account estimates of magnetic deviation, turned out to be between the model positions of 2000-2020, according to the IGRF13 model and closer to the 2020 era.
The current rate of displacement of the SMP is estimated at about 6 km per year. At low displacement rates of the SMP, errors in predicting its position are very critical.
Solving the issue of the anomalous movement of the SMP requires repeated experiments and estimates of the position of the SMP using data from high-precision magnetic observatories.
- Tertyshnikov AV. Estimates of magnetic declinations in the Southern Ocean 04/6-9/2020. XXIX All-Russian interdisciplinary seminar - conference of the Geological and Geographical faculties of Moscow State University “Planet Earth System”, Moscow, Moscow State University. February 5-6, 2021.
- Tertyshnikov AV. Approbation of technology for assessing the position of the magnetic pole. Materials of the X International Scientific and Practical Conference. Marine research and education - MARESEDU 2021. Moscow, October 25-29, 2021.
- Yanovsky BM. Terrestrial magnetism. L.: Leningrad State University. 1978; 592.
- Tertyshnikov AV. Magnetic Indices. Moscow-Obninsk. 2014; 178.
- Finlay CC, Maus S, Beggan CD, et al. International Geomagnetic Reference Field: the eleventh generation. Geophys J Int. 2010 Dec;183(3):1216-1230. doi: 10.1111/j.1365-246X.2010.04804.x.
- Love JJ, Chulliat A. An International Network of Magnetic Observatories. Eos. 2013 Oct 15;94(42):373-374. doi: 10.1002/2013EO420001.
- WMM2020. Available from: https://www.ngdc.noaa.gov/geomag/WMM/image.shtml.
- Tertyshnikov AV. Estimates of the position of the north magnetic pole based on measurements from the R/V “Professor Molchanov” 10.26.2021 – 11.09.2021. Geliogeofizicheskie issledovaniya. 2021;31:58-61. (in Russian) doi: 10.54252/2304-7380_2021_31_58.
- Macmillan S, Maus S, McLean S, et al. Error estimates for geomagnetic field values computed from the BGGM. Tech Rep WM/93/28C. 1993. British Geological Survey, Keyworth, Nottingham, UK.
- Golynsky A, Golynsky D, Ferraccioli F, et al. A Digital Magnetic Anomaly Map of the Antarctic. Available from: https://www.researchgate.net/project/ADMAP-2-the-next-generation-magnetic-anomaly-map-of-the-Antarctic. 2006.
- Tikku A.A., Cande S. (1999) The oldest magnetic anomalies in the Australian-Antarctic Basin: are they isochrons? J Geophys Res 104: 661–677
- Petrova A. et al. Verification of the Earth's magnetic field component model based on observations on the CHAMP and Swarm satellites. Available at: https://geo.phys.spbu.ru/geocosmos/2020/data/data/htmls/EG/EG010.html
- Donderisi B., Moss Clinton J. Method and system for magnetic ranging and geonavigation. Application 2016116776 dated 12/23/2013. Application publication date: 01/30/2018. Bulletin no. 4, published: 10/17/2018, bulletin. no. 29.
- Gvishiani A.D., Lukyanova R.Yu. Assessing the influence of geomagnetic disturbances on the trajectory of directional drilling of deep wells in the Arctic region. Fizika Zemli [Physics of the Earth]. 2018, no. 4, pp. 19–30. (in Russian) DOI: 10.1134/S0002333718040051
- Ivanov S. et al. Three-component magnetic measurements during the round-the-world expedition of R/V “Admiral Vladimirskij”: experience and perspectives / 13th International Conference and School "Problems of Geocosmos" March 24-27, 2021 / https http://geo.phys.spbu.ru/geocosmos/2020/
- EMAG3: NGDC's candidate for the World Digital Magnetic Anomaly Map. http://geomag.org/models/wdmam.html
- Maus S. еt al. EMAG2: A 2–arc min resolution Earth Magnetic Anomaly Grid compiled from satellite, airborne, and marine magnetic measurements. An electronic Journal of the Earth Sciences «Geochemistry, Geophysics, Geosystems». Technical Brief. V. 10, no 8, 7 August 2009. Q08005, DOI:10.1029/2009GC002471.
- EMAG2: Earth Magnetic Anomaly Grid (2-arc-minute resolution). https://www.ngdc.noaa.gov/geomag/emag2.html
- Di Segnidalcielo - 26/09/2017 La NASA sta monitorando in gran segreto una enorme “Anomalia Magnetica” in Antartide . Available at: https://www.segnidalcielo.it/la-nasa-sta-monitorando-in-gran-segreto-una-enorme-anomalia-magnetica-in-antartide/
- Space Weather Data. http://www.celestrak.com/SpaceData/SW-Last5Years.txt
- Tertyshnikov AV. Method for determining the position of the Earth's magnetic pole. Patent R, appl. no 2020134228/28(062757) dated 10/19/2020.
- Tertyshnikov AV. Estimates of the position of the north magnetic pole in 2021 based on data from the scientific expedition vessel “Mikhail Somov”. Geliogeofizicheskie issledovaniya. 2022;34:49-51. doi: 10.5425/2304-7380_2022_34_49.
- Kudenko A. The Russian Geographical Society told when the position of the south magnetic pole will be known. Available from: https://ria.ru/20200609/1572686327.html.
- Data Poles. https://www.ngdc.noaa.gov/geomag/data/poles/SP.xy.
- Data Poles WMM2020. https://www.ngdc.noaa.gov/geomag/data/poles/WMM2020_SP.xy.
- Gvishiani AD, Lukyanova RYu. Geoinformatics and observations of the Earth’s magnetic field: Russian segment. Fizika Zemli. 2015;2:3-20.
- Lukomsky YA. Navigation and vessel traffic control. St. Petersburg: Elmor Publ. 2002; 360.
Article Alerts
Subscribe to our articles alerts and stay tuned.
 This work is licensed under a Creative Commons Attribution 4.0 International License.





 Save to Mendeley
