Annals of Limnology and Oceanography
Mechanism Design of Seafloor Current Meter (SCM) with Broadband OBS and Data Analysis in the Northeastern offshore Taiwan
Ching-Ren Lin*
Senior Research Scientist, Institute of Earth Sciences, Academia Sinica, Taipei, Taiwan
Cite this as
Lin CR. Mechanism Design of Seafloor Current Meter (SCM) with Broadband OBS and Data Analysis in the Northeastern offshore Taiwan. Ann Limnol Oceanogr. 2024;9(1):009-020. Available from: 10.17352/alo.000017Copyright
© 2024 Lin CR. This is an open-access article distributed under the terms of the Creative Commons Attribution License, which permits unrestricted use, distribution, and reproduction in any medium, provided the original author and source are credited.To achieve precise measurements of near seabed water current velocities, this study designed a mechanical device for the Aquadopp-6000m Current meter that can be paired with the Yardbird-BB Ocean Bottom Seismometer (OBS). To ensure it does not affect the sinking rate during deployment or the buoyancy during recovery at sea, the overall ballasting of the OBS with the integrated water current meter needed to be recalibrated. The Aquadopp-6000m can record multiple physical data parameters simultaneously. During instrument deployment tests, we recorded the orientation of the entire OBS, time of seabed contact, time of seismic sensor detachment from the A-frame and falling onto the seabed, as well as profiles of sound speed, temperature, and pressure during the instrument sinking process.
In deployment planning, it was determined that the original battery capacity inside the Aquadopp-6000m was insufficient to sustain the power consumption required for sampling rates of one sample per second for more than three months. This paper also provides detailed calculations for battery power and methods for modifying battery packs.
Data from deployments in the Okinawa Trough in 2019 and 2020 indicated that seabed water current velocities and seismic activity share similar frequency characteristics over long periods. For seismic wave amplitudes greater than 0.006 m/s, there were intermittent decreases in water flow velocity following the arrival of radial S-waves, while the tangent component remained unaffected. Before the formation of typhoons thousands of kilometers away, atmospheric pressure variations were observed to influence minor changes in seabed temperature, seabed flow velocities, and seawater pressure, thereby affecting oceanic sound speed.
Introduction
In the measurement of water current velocities, sound waves are commonly utilized to detect the Doppler effect from small scattering particles. The well-known Acoustic Doppler Current Profilers (ADCPs) are built on this principle [1]. ADCPs incorporate piezoelectric transducers for transmitting and receiving sound signals. The time taken by sound waves provides an estimate of the distance, while the frequency shift of the echo is directly proportional to the water velocity along the acoustic path [2]. These devices, mounted on ships or moorings, exploit the Doppler frequency shift from an acoustic ping to infer water velocity, calculating an average velocity over selected depth ranges (bins or cells). ADCPs are capable of measuring currents, waves, turbulence, ice drift, acoustic backscatter, and more within specific depth ranges, and find applications in studies concerning the Kuroshio hydrological characteristics [3], Internal Waves [4], Intra-seasonal oscillations [5], and others.
Although ADCPs have been widely used for measuring water flow velocities, for precise measurements of near-bed water velocities, employing single-point velocity meters appears to be an appealing alternative. For instance, they are utilized to measure near-seafloor currents [6], seabed current velocity in cold seep vents [7], and near-bottom (2 m) current velocities [8]. The Aquadopp 6000m single-point velocity meter can also measure both the intensity and direction of ocean currents for studying seafloor water columns [9,10], concurrent assessment of current and suspended sediment concentration [11], surface flow speed for studying sediment dynamics [12].
To distinguish between noise sources of the horizontal component of the Ocean Bottom Seismometer (OBS) arising from either the seabed crust or water flow, it seems preferable to utilize single-point current meters to collect physical data near the seabed for comparison. This study adopts the Aquadopp-6000m Current Meter and designs a mechanical holder that can be installed on the Yardbird-BB OBS [13] platform, thereby creating a Seafloor Current Meter (SCM). The SCM is used to observe the water current velocity near the seabed, using actual observational data to understand whether the background noise of the seismometer is affected by water flow impacts. Additionally, installing the current meter on the OBS allows for the observation of changes in posture during the deployment process, sinking speed, the time it takes to settle on the seabed and the time of the seismometer falling onto the seabed. The Aquadopp-6000m also includes a compass for measuring instrument orientation, inclinometers for measuring tilt angles, and temperature and pressure sensors for assessing surrounding seawater conditions. Data collected by the SCM can also be used to analyze posture changes and sinking speed during instrument deployment, the time spent on the seabed, and the moment the seismic sensor lands on the seabed. Since the duration of most small-scale earthquakes is less than one minute, to understand the relationship between water current velocity and seismic activity, it is necessary to increase the measurement interval to 1 s. We upgraded the internal memory capacity of the Aquadopp-6000m to 9GB and provided additional battery power from within the OBS.
The noise analysis system is based on the calculation of the Power Spectral Density (PSD) distribution using a probability density function [14,15]. This study analyzed 4 hours without seismic activity using data recorded by the instrument. From the PSD results, it can be observed that in the horizontal component, after increasing the seismic signal by 65 dB, seismic activity and water flow velocity exhibit similar frequency characteristics in the range of 3x10⁻³ – 2x10⁻² Hz. Similarly, in the vertical component, after increasing the seismic signal by 100 dB, seismic activity and water flow velocity also exhibit similar frequency characteristics in the range of 1x10⁻³ – 2x10⁻² Hz. These results indicate that seabed current velocity and seismic activity share similar frequency characteristics over long periods, though with differences in intensity, suggesting that ground vibration signals at certain periods can resonate with seabed water flow. Analysis of the spectrogram of small earthquakes reveals intermittent decreases in current velocity after the arrival of S waves. Comparing the PSD values of seismic signals with current velocity, it is found that increasing the amplitude of seismic signals results in similar amplitude characteristics in certain frequency ranges. This study also found that changes in atmospheric pressure before the formation of typhoons thousands of kilometers away can affect seawater pressure, seabed flow velocity, subtle changes in seabed temperature, and consequently, variations in ocean sound speed.
The principle and specifications of the current meter
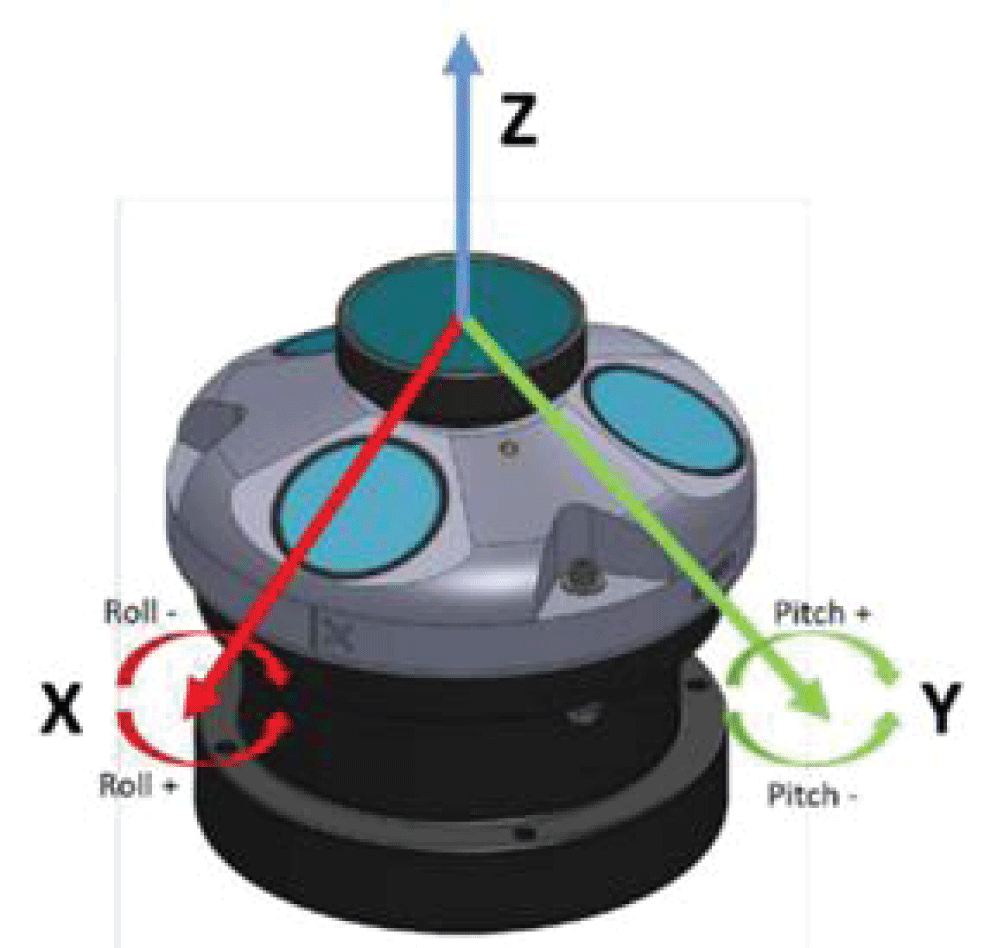
The current meter used in this study is the Aquadopp-6000m Current Meter (http://195.62.126.26/en/products/CurrentMeter/Aquadopp6k). Its principle involves transmitting 2 MHz sound pulses into the water. The sound propagates along narrow beams and is scattered by small objects or plankton suspended in the water. By analyzing the frequency changes (Doppler shift) of the echoes received by the transducer, water velocity is calculated along each beam. By combining velocity measurements with precise beam measurements, 2D (two-beam) or 3D (three-beam) velocity can be calculated and recorded internally or reported online. In addition to velocity measurement, the Aquadopp-6000m also includes a compass and inclinometer for instrument orientation. It also includes a thermometer and barometer for measuring seawater temperature and pressure around the instrument, which can be used to estimate seabed depth and ocean sound speed. Therefore, its recorded data includes the following nine parameters: Velocity (m/s), Amplitude (Counts), Pressure (dbar, m), Temperature (degrees C), Sound speed (m/s), Direction (degrees), Heading (degrees), Pitch (degrees), and Roll (degrees). The specifications are shown in Table 1. The definitions of Direction, Heading, and Pitch are shown in Figure 1.
The Aquadopp® Current Meter can measure the water current velocity in a single volume.
The mechanical device design for the current meter in conjunction with the Yardbird-BB OBS
While the current velocity measured by the acoustic profiler suspended from the surface buoy (suspended AQD) was commonly known to be of poor quality due to the extensive influence of surface waves [16], deploying the OBS on the seabed with a depth greater than 1000m should mitigate this issue. The seismic sensor of the broadband OBS is directly placed on the seafloor surface, resulting in horizontal component environmental noise levels recorded by the OBS being 10 - 40 dB higher than vertical component environmental noise levels [17]. To confirm whether the noise source of this horizontal component originates from the sea bottom, single-point velocity meters can be used to compare seabed physical data. In this study, we use the Aquadopp-6000m Current Meter mounted on the broadband OBS from the Institute of Earth Sciences, Academia Sinica (code-named Yardbird-BB) [13,17-19]. The Aquadopp-6000m Current Meter has a titanium alloy casing and can be directly deployed in seawater, with a maximum deployment depth of 6000m, the same as the Yardbird-BB. This study designed a mechanical device (holder) that can attach the Aquadopp-6000m to the Yardbird-BB OBS platform, creating a Seafloor Current Meter (SCM), allowing the SCM to detect disturbances in water flow above the OBS sensor.
The A-frame of the Yardbird-BB OBS is utilized to suspend the seismic sensor during deployment. Several hours after the OBS is submerged, the seismic sensor autonomously detaches from the A-frame and settles on the seabed. This design is primarily aimed at preventing water flow near the seabed from impacting the OBS platform and inducing noise. Despite the distance between the seismic sensor and the OBS platform, the horizontal component noise of the OBS remains susceptible to interference from nearby seabed water flow, resulting in relatively higher noise levels. Hence, analyzing the correlation between water current velocity above the OBS seismic sensor and the horizontal noise of the seismic sensor provides valuable insights. In this study, a holder is designed to invertly mount the Aquadopp-6000m above the OBS A-frame. This setup allows for the measurement of water current velocity above the OBS seismic sensor and facilitates the determination of the seismic sensor detachment time by measuring the vibrations of the A-frame.
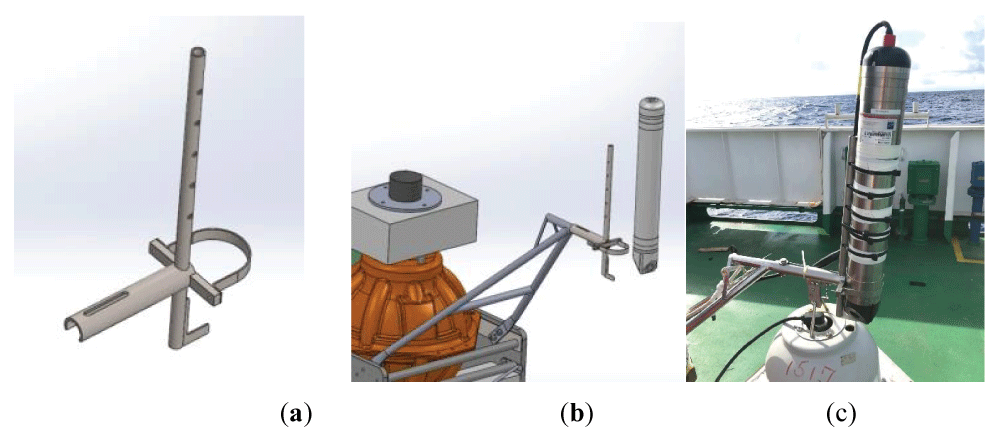
The holder is made of weakly magnetic SUS316 stainless steel material to avoid magnetic interference with the internal compass accuracy, as depicted in Figure 2a. Mounting the Aquadopp-6000m is illustrated in Figure 2b,2c. The holder features a groove embedded at the front end of the A-frame, with an 11 mm diameter hole on the A-frame, secured with a stainless steel screw. An L-shaped bracket supports the transducer head, while the U-shaped ring and five circular holes on the holder rod are utilized with nylon straps to secure the Aquadopp-6000m.
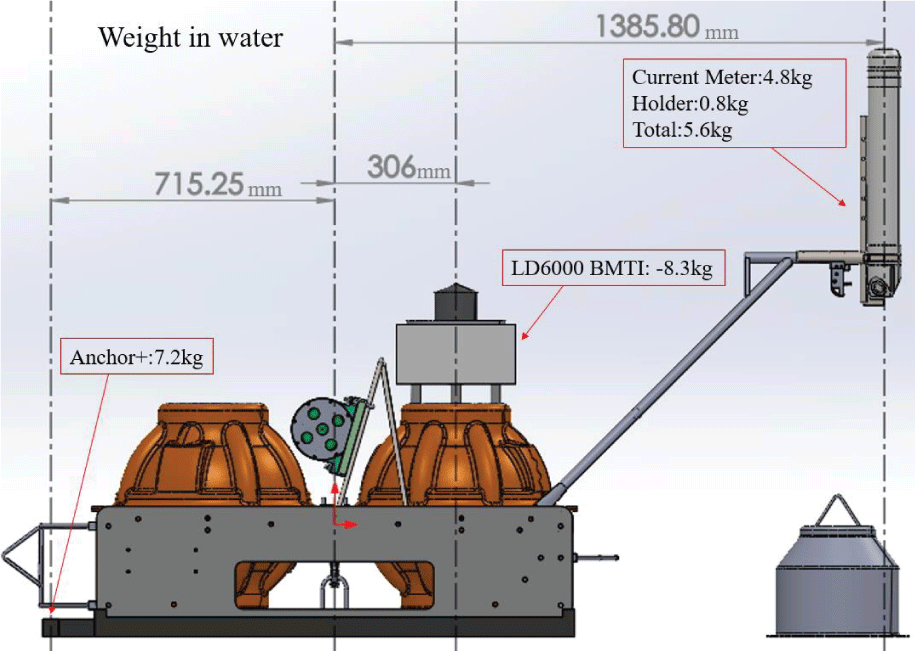
The original weight of the Yardbird-BB OBS with a 50.2 kg anchor submerged in water is 32 kg. The buoyancy without the anchor is 17.4 kg. The Aquadopp-6000m weighs 4.8 kg underwater, and the holder weighs 0.8 kg underwater. To maintain the instrument’s leveling during descent and ensure the speed of instrument recovery, an additional 7.2 kg anchor weight is added to the tail end of the OBS, and 9.8 kg of buoyancy material is added above the instrument glass sphere (providing 8.3 kg of buoyancy in water), resulting in total submerged weight with the anchor of 37.4 kg and buoyancy without the anchor of 20 kg (Figure 3).
The instrument settings of the Aquadopp-6000m current meter (power consumption, data volume)
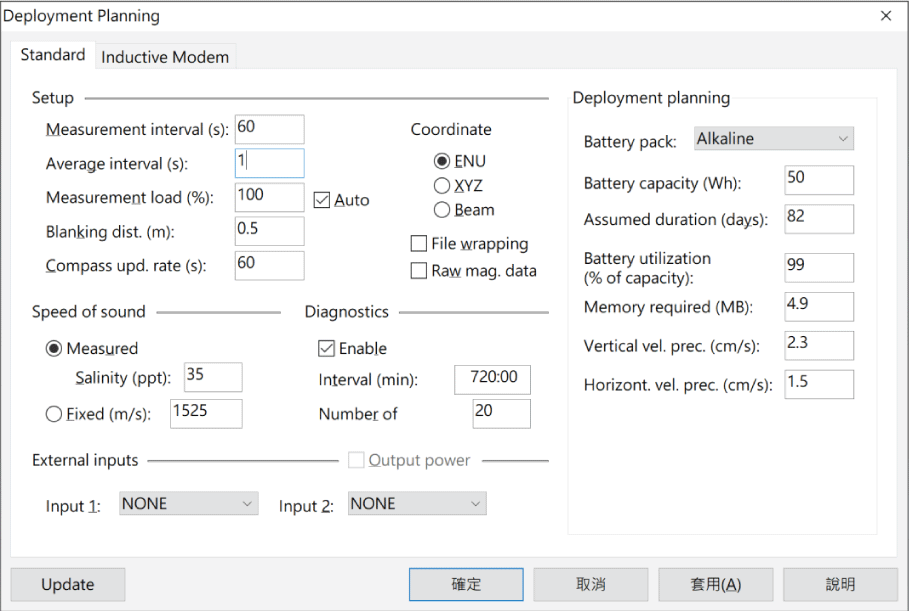
The Aquadopp-6000m current meter comes equipped with a 50 Wh battery pack composed of 18 alkaline batteries and 9 Mbyte of memory. According to deployment planning calculations, recording a data point every 60 s, it can only execute observations for 82 days (Figure 4).
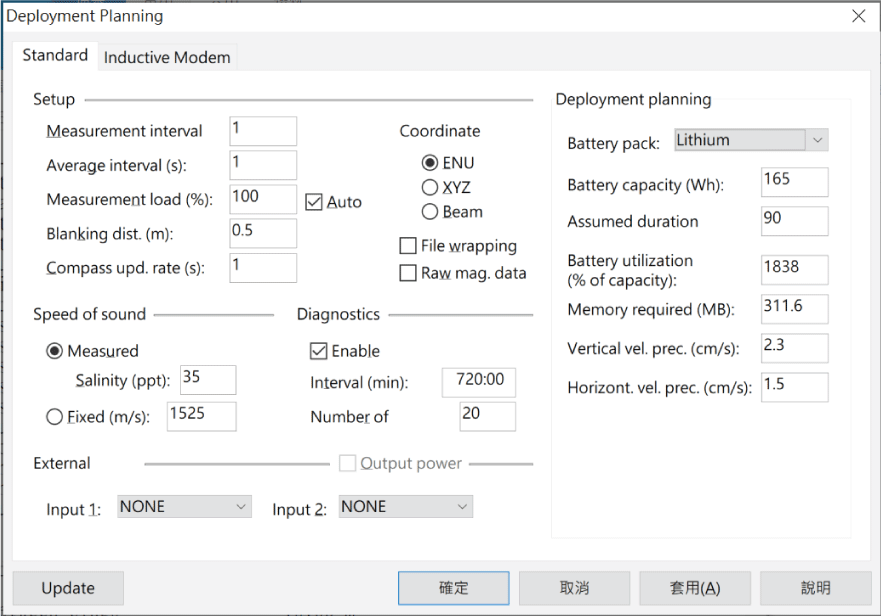
Due to space constraints within the Aquadopp-6000m housing, it is unable to accommodate additional batteries for high sampling rate data collection. Therefore, additional watertight compartments are necessary to house the required battery pack. A Lithium-type battery pack with a capacity of 165 Wh is selected. To record data for 90 days (Assumed duration = 90), the recalculated Battery utilization for Deployment planning is 1838%. After deducting the internal lithium battery pack of the current meter, an additional 14.4 V lithium battery pack is required. The calculation is as follows:
165 x (1838-100) / 100 / 14.4 = 199.2 (Ah). [1]
If using 4 TL-5930 (3.6 V, 19 Ah) batteries connected in series to assemble a 19 Ah, 14.4 V battery pack, a total of 11 sets are required. The memory capacity must also exceed 312 MByte (Figure 5).
From the calculations in Figure 5, with a measurement interval of 1 s, the required battery capacity for 90 days of operation is 199.2 Ah. Reverse calculating, the current consumption of the current meter is:
199.2 Ah / (90*24 h) = 0.0922 A [2]
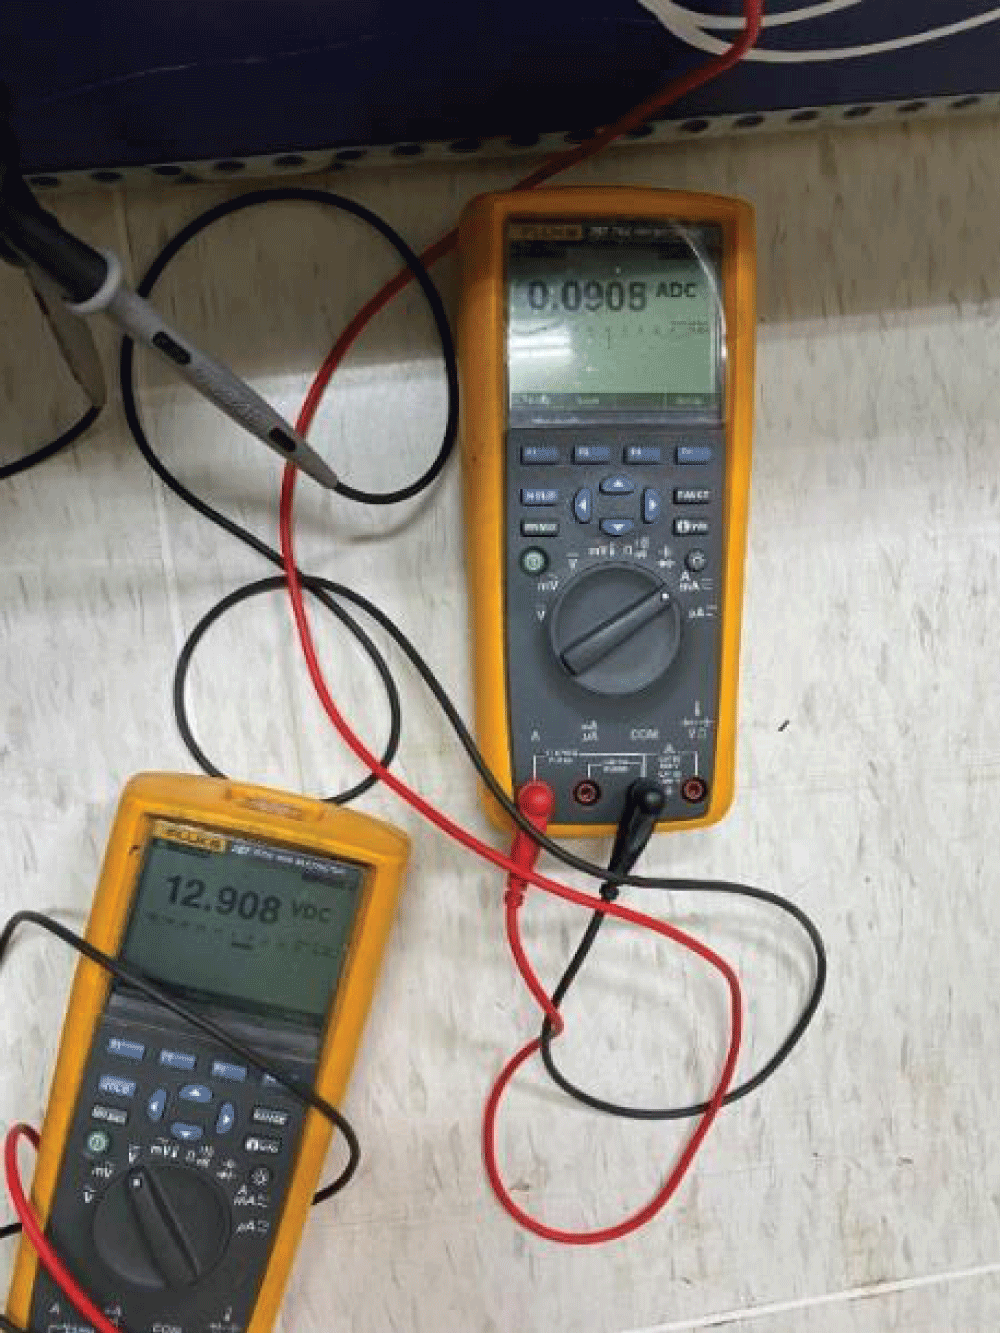
We used a Digital Multimeter to measure the current and voltage of the current meter battery being recorded, which were 0.0908 A and 12.908 V respectively (Figure 6). These values are very close to the calculated values from Deployment planning, thereby confirming the accuracy of the Deployment planning calculation.
Marine data analysis
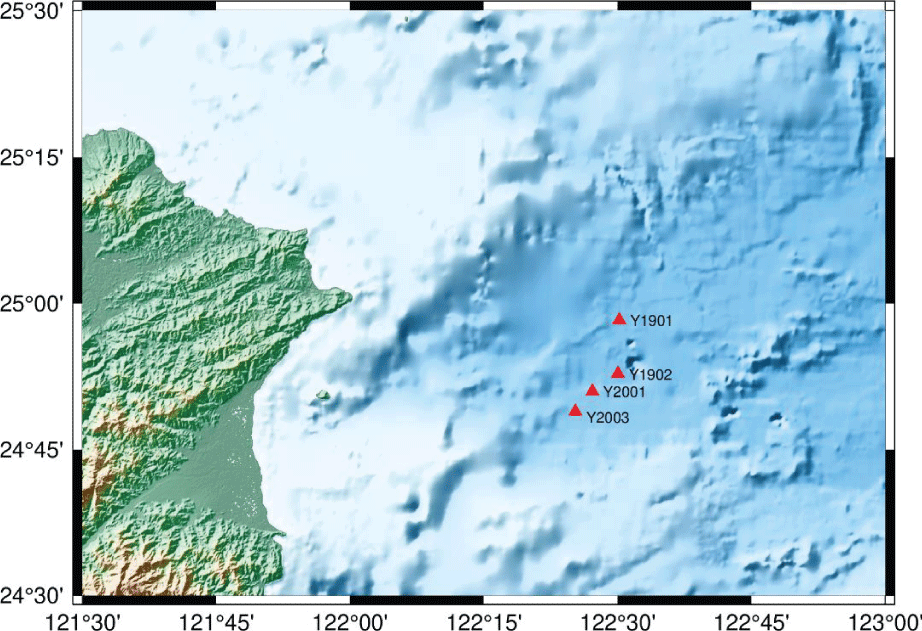
In the original setup, the Aquadopp-6000m current meter was equipped with only a 50 Wh battery capacity and 9 MB memory. We set up a 60 s measurement interval, 1 s average interval, and 1s compass update rate. Subsequently, we deployed them with Yardbird-BB OBSs at stations Y1901 and Y1902 offshore NE Taiwan from 2019/03/21 to 2019/05/27 (Figure 7). The Deployment planning is shown in Figure 4.
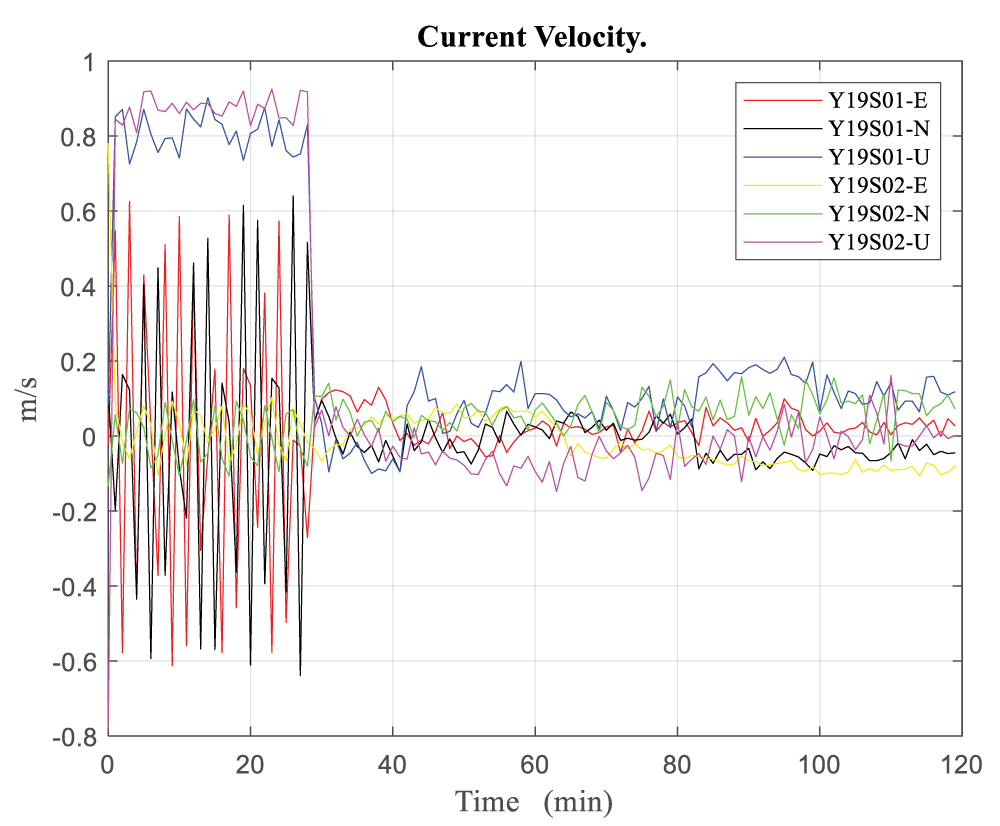
We analyzed the data from the instruments two hours after immersion. Figure 8 shows the Current Velocity. It indicates that Y1901 descended at a rate of approximately 0.8 m/s, while Y1902 descended at around 0.9 m/s. Both OBSs settled on the seabed approximately 29 minutes after immersion.
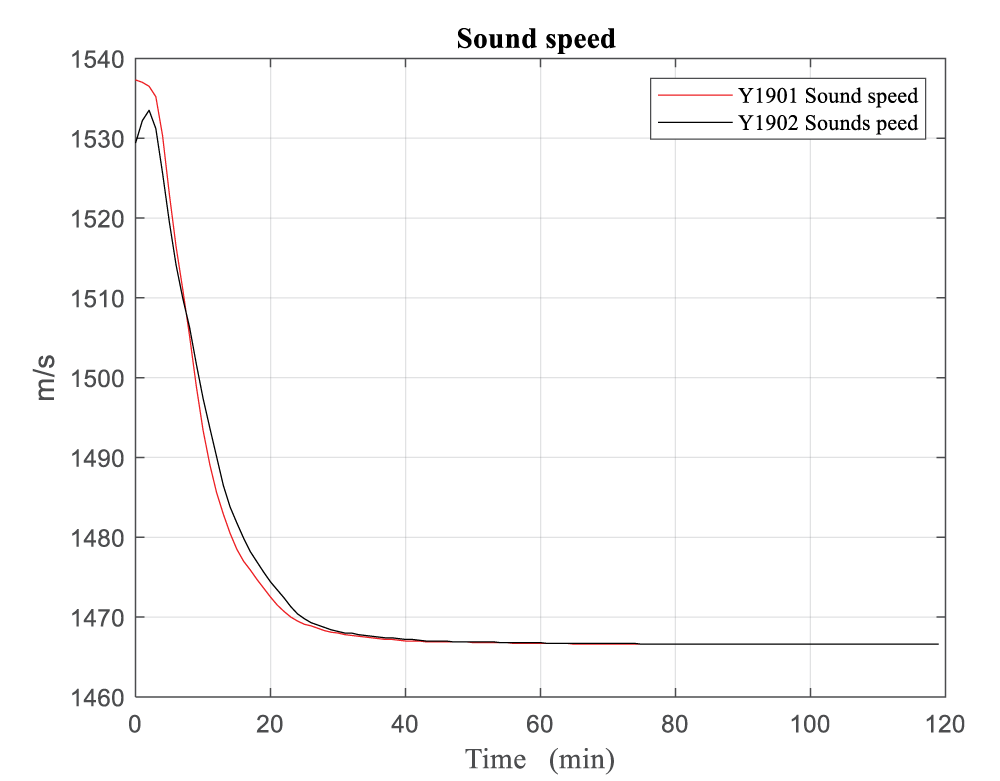
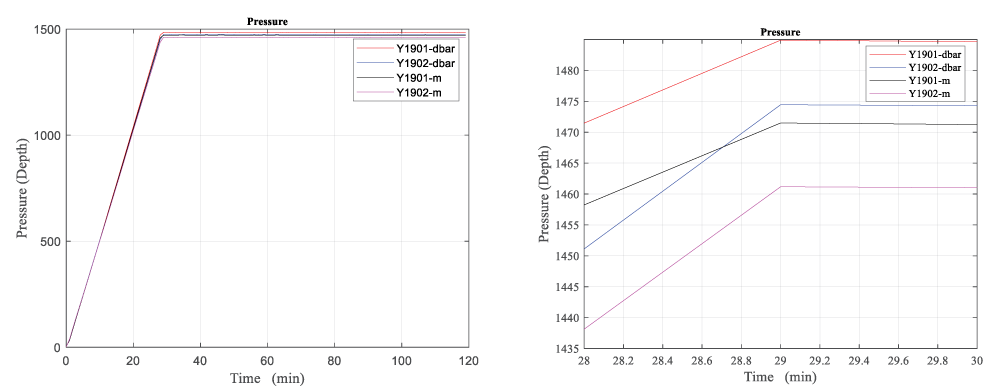
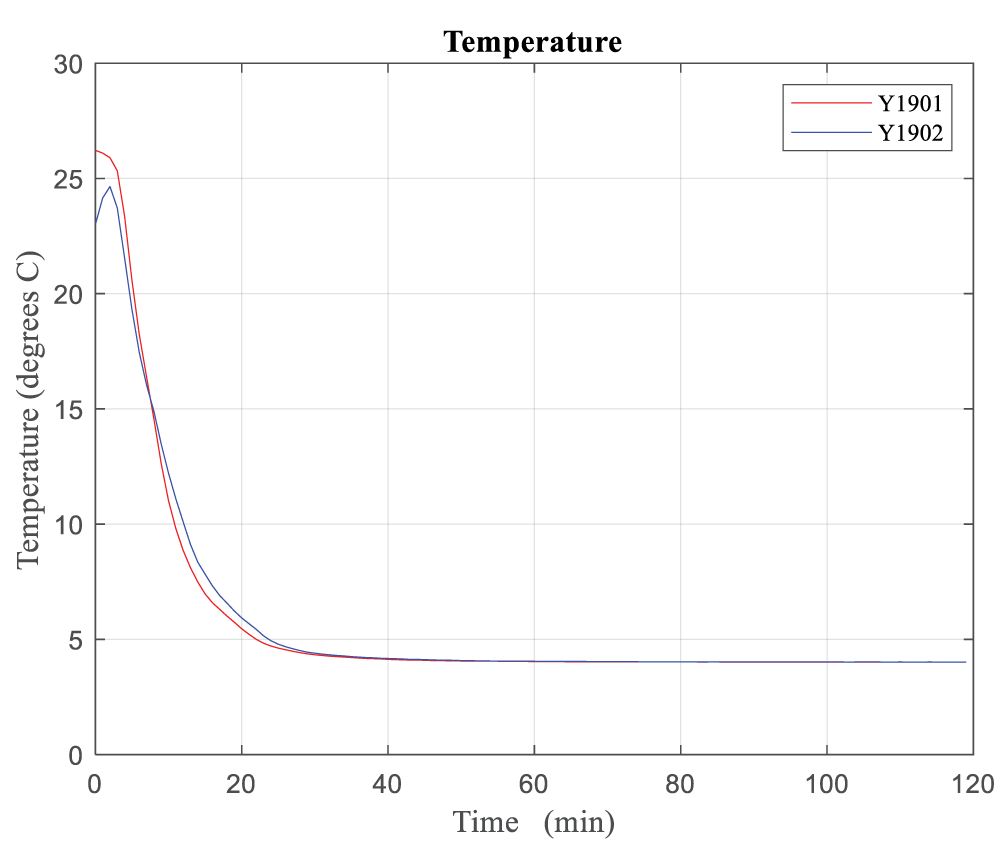
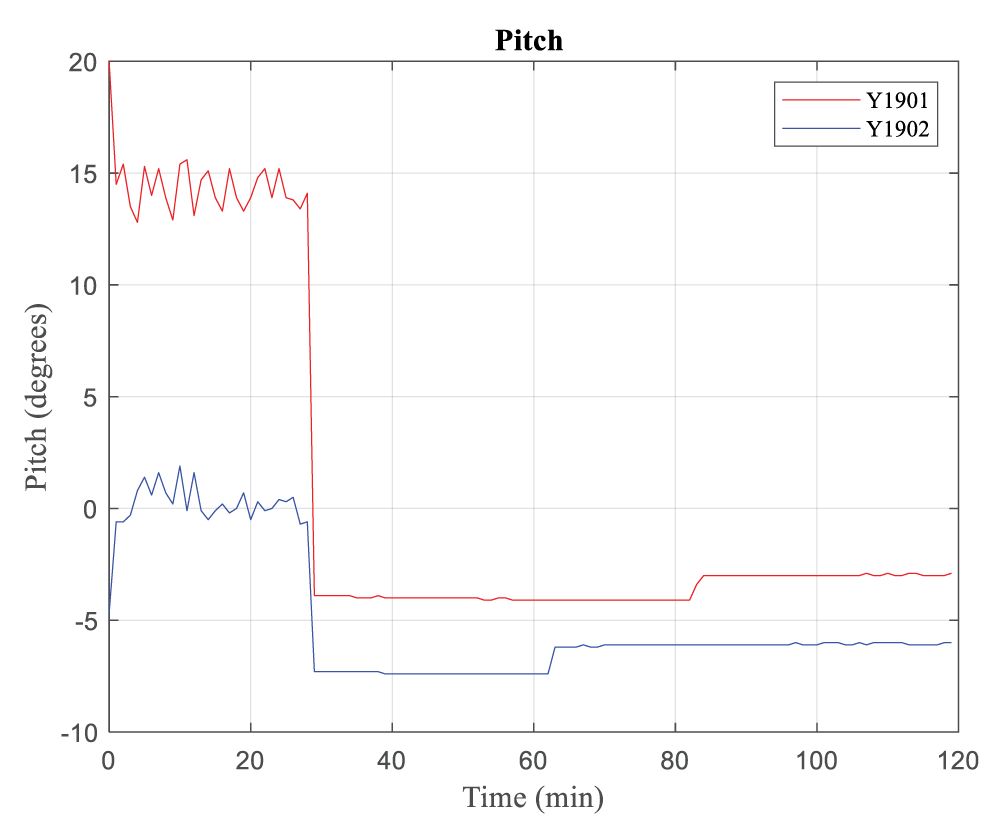
The Current Velocity on the seabed is less than +/- 0.15 m/s. Figure 9 shows the Sound speed at stations Y1901 and Y1902 was 1466.6 m/s. The Pressure curve indicates that both OBSs reached the seabed in the 29th minute after immersion, with depths of 1471 m and 1461 m respectively for stations Y1901 and Y1902 (Figure 10). The Temperature curves show that the seabed temperature at both stations is 4.1 degrees C (Figure 11). The Pitch curves also demonstrate that both OBSs reached the seabed in the 29th minute after immersion. The Seismic sensor of station Y1901 landed on the seabed in the 83rd minute, while for Y1902, it was in the 62nd minute (Figure 12).
The relationship between seismic background noise and surrounding water currents
Since the duration of most small-scale earthquakes is less than 1 minute, to understand the relationship between earth background noise and surrounding water current velocity, it is necessary to increase the measurement interval to 1 s. This would allow for analysis of current velocity before, during, and after the earthquake. However, increasing the measurement interval results in higher memory usage and power consumption. Therefore, the internal memory capacity of the Aquadopp-6000m needs to be upgraded to 9GB, and additional battery power must be supplied to the Aquadopp-6000m from within the OBS.
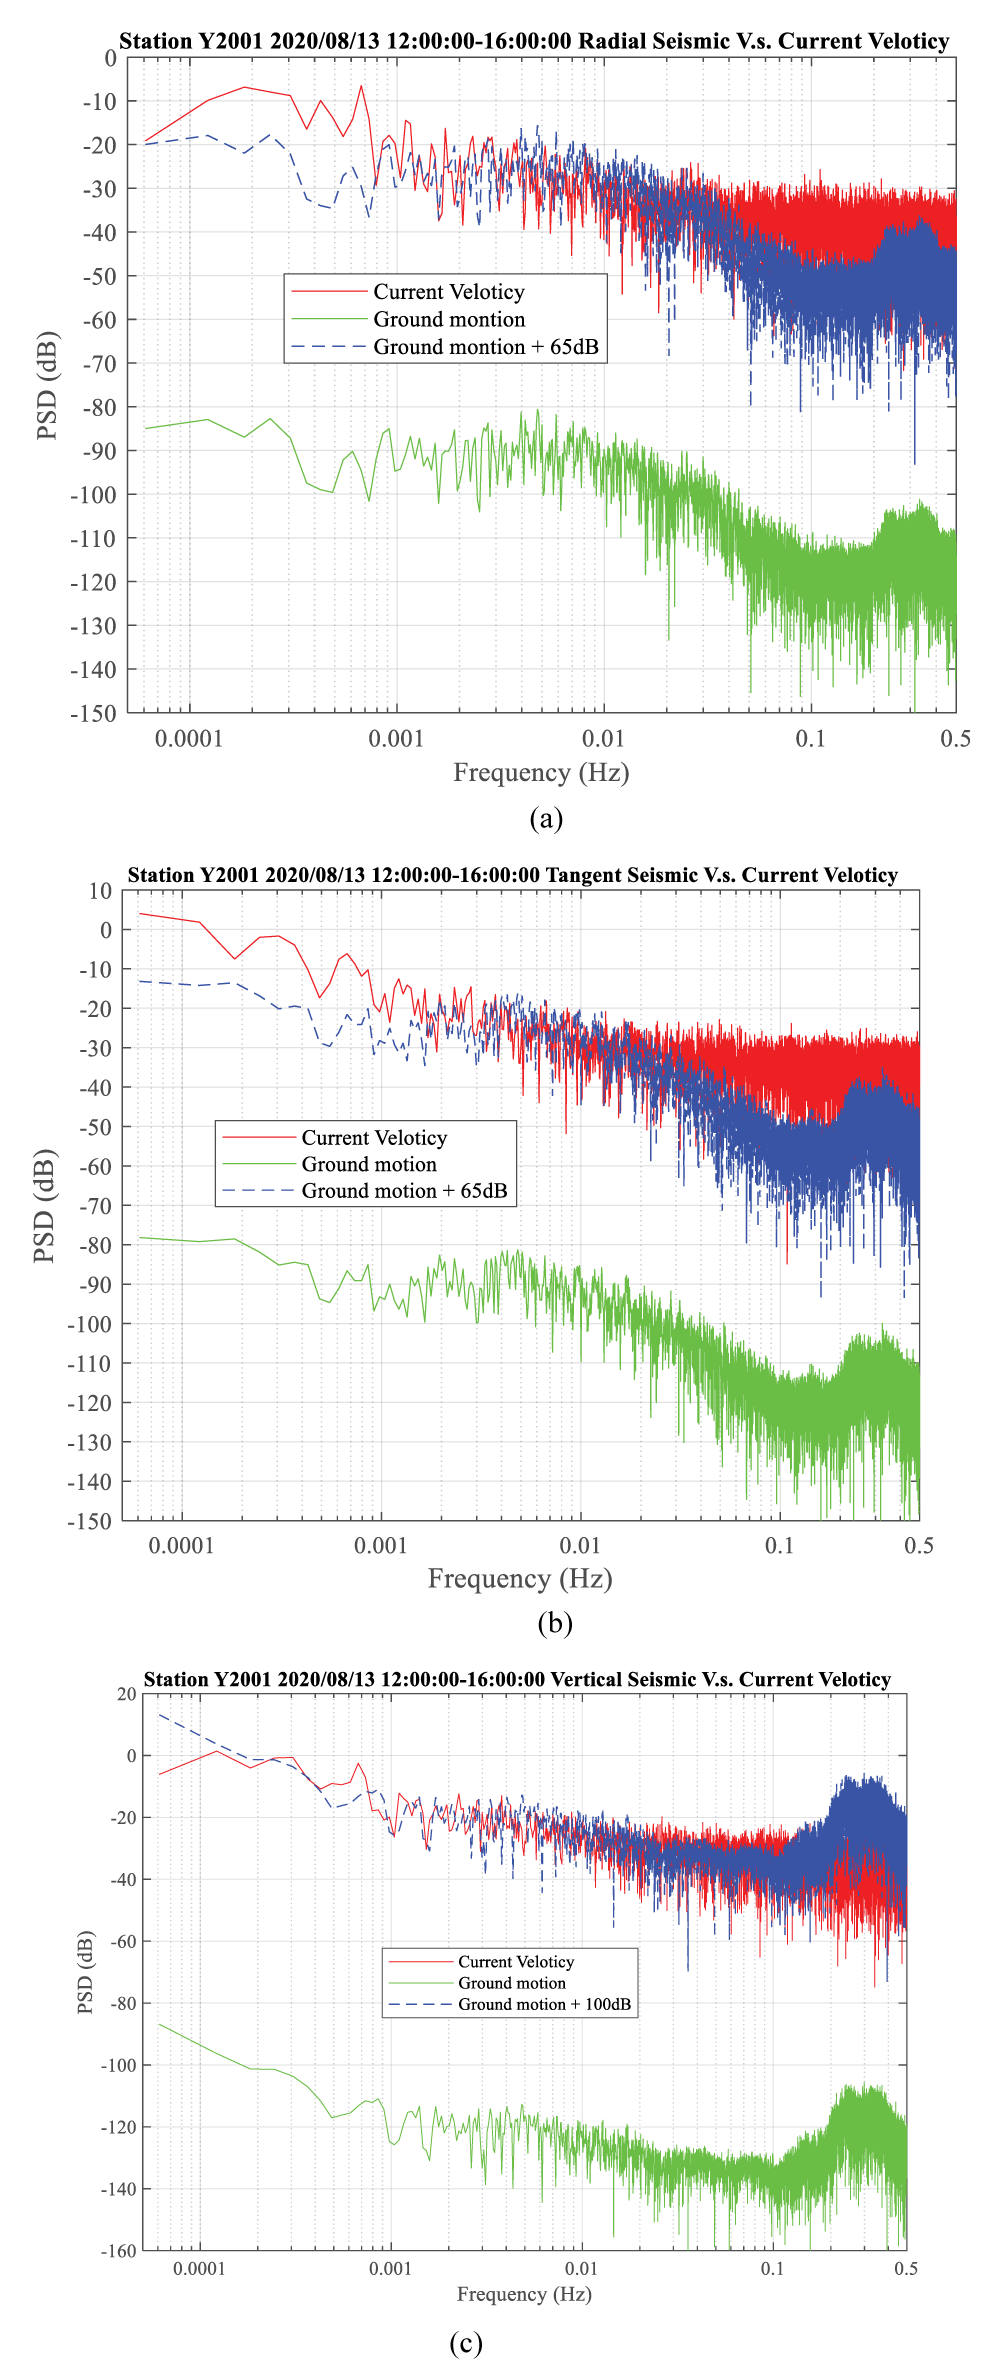
Two instruments were deployed at the Okinawa Trough from 2020/08/09 to 2020/09/28, namely stations Y2001 and Y2003. Analysis of the data of OBS and SCM from station Y2001, collected over four hours without any seismic events, revealed from the seismic noise level in PSD results (Figure 13) that in the horizontal component, after enhancing the seismic signal by 65 dB, seismic activity exhibited similar frequency characteristics to water current velocity in the frequency range of 3x10⁻³ – 2x10⁻² Hz. Similarly, in the vertical component, after enhancing the seismic signal by 100 dB, seismic activity exhibited similar frequency characteristics to water current velocity in the frequency range of 1x10⁻³ – 2x10⁻² Hz. This indicates that the frequency characteristics of seabed water current velocity and seabed seismic activity are similar over long periods, with differences in intensity. It suggests that ground vibration signals at certain periods can resonate with seabed water flow.
The influence of earthquakes on water current velocity
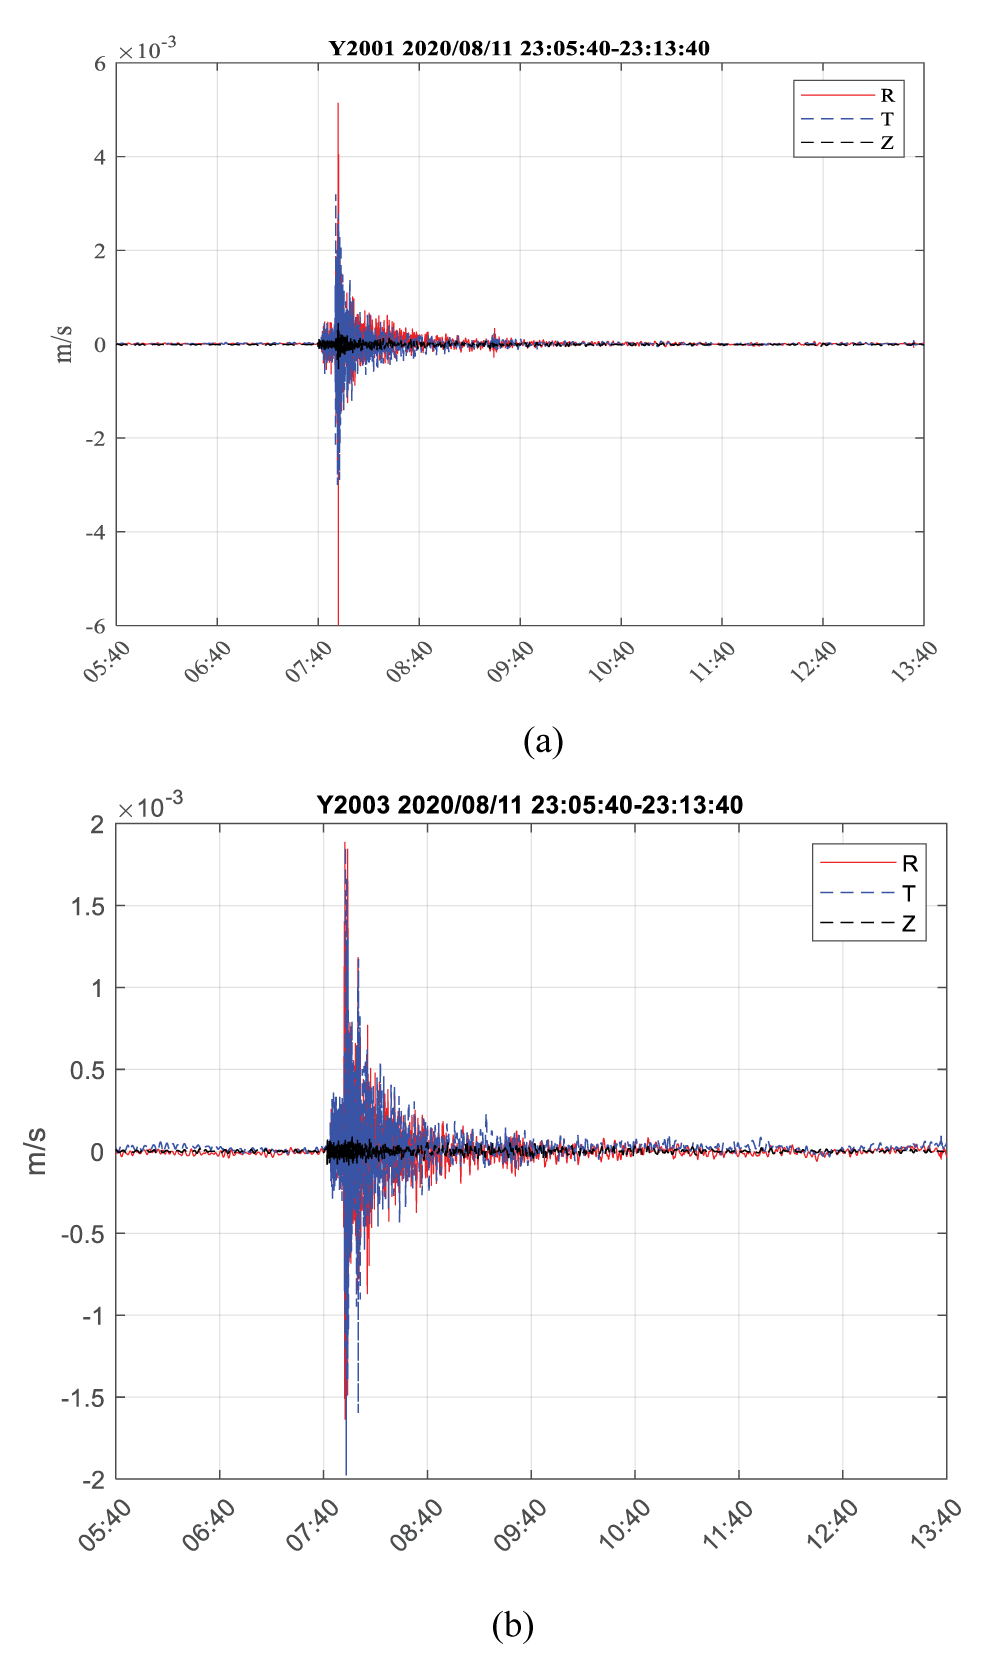
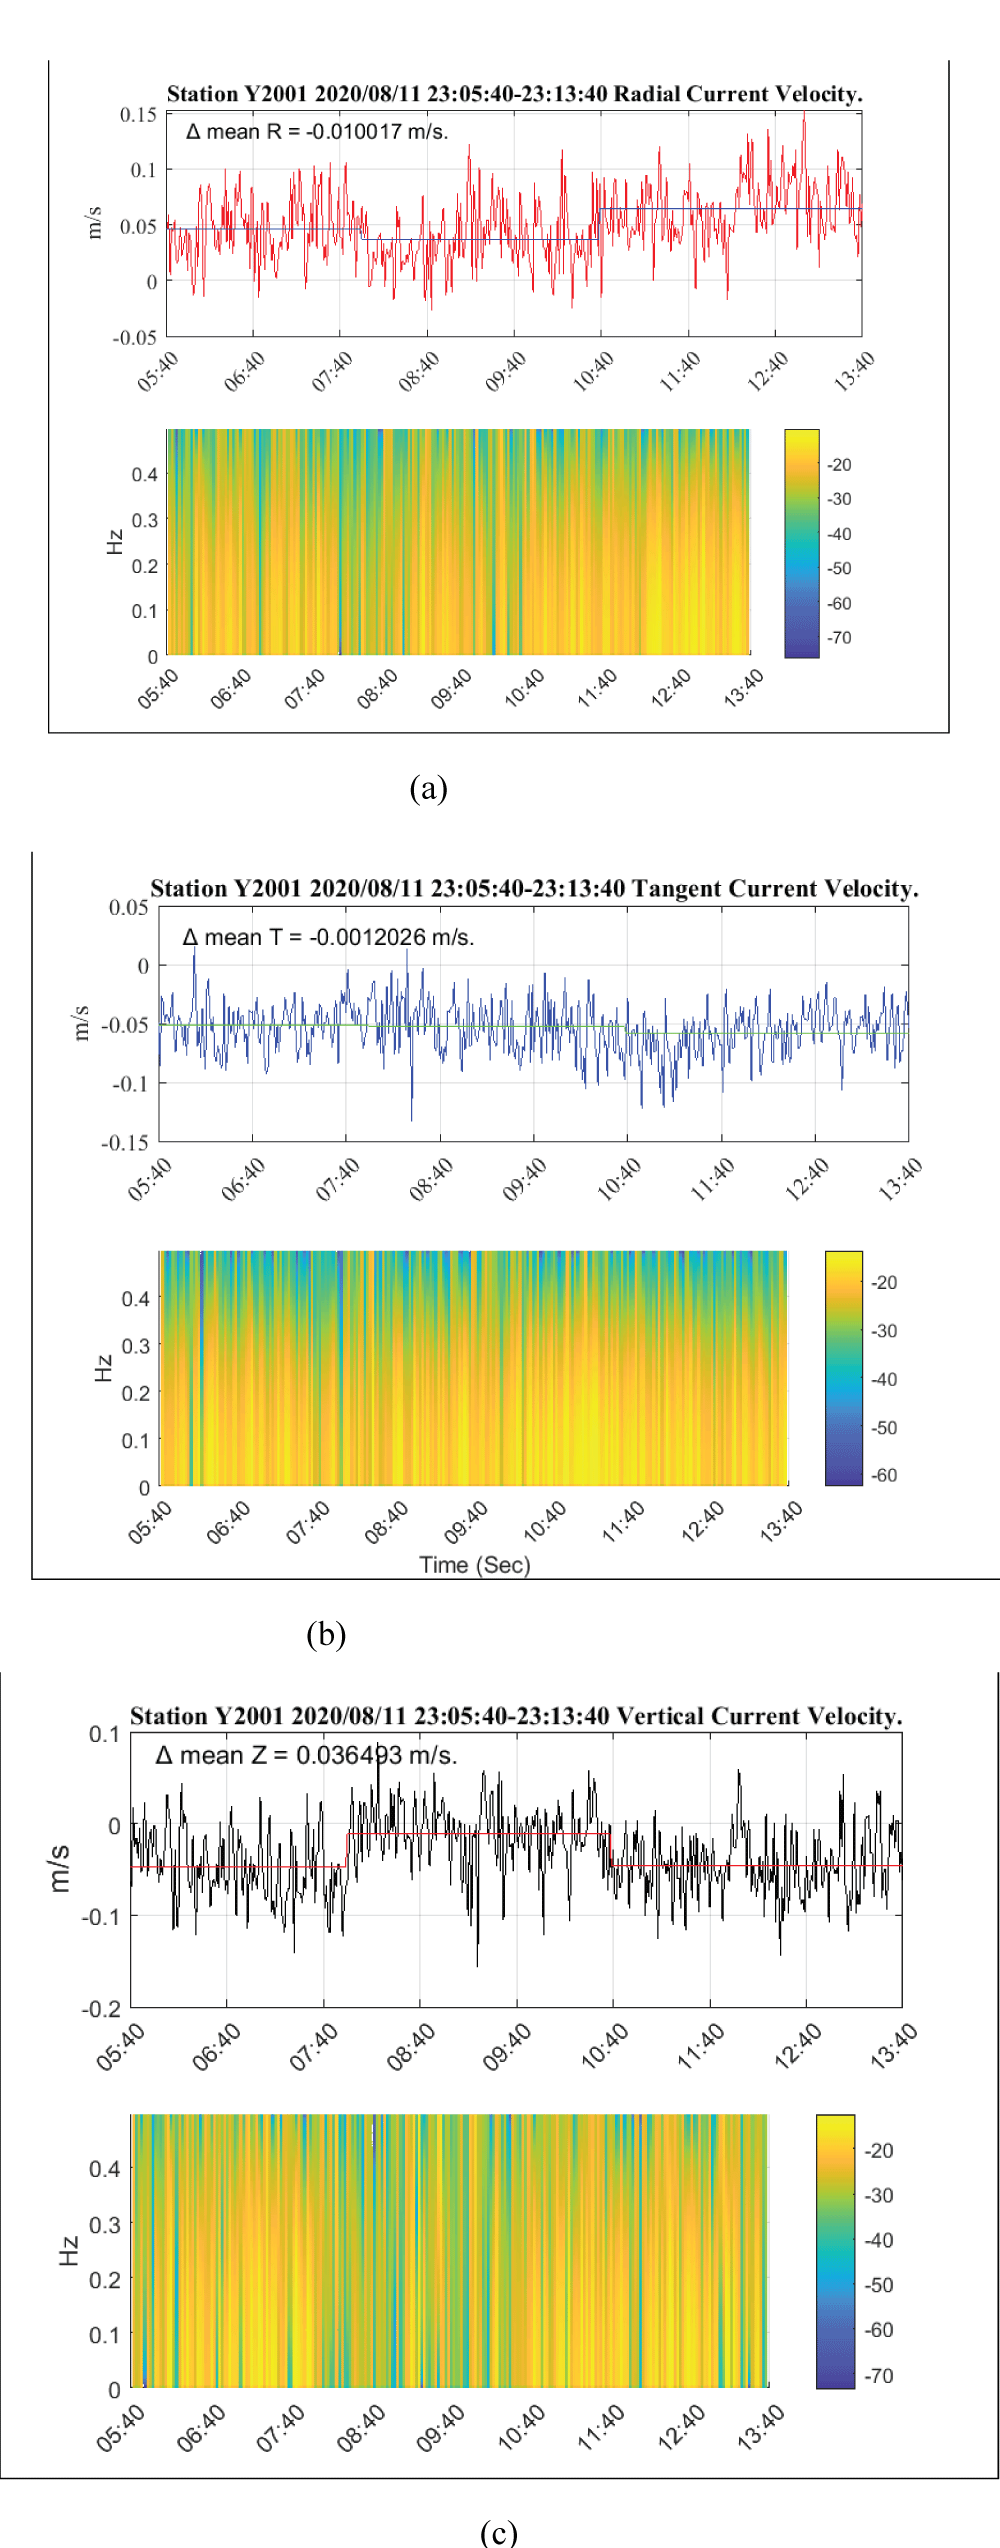
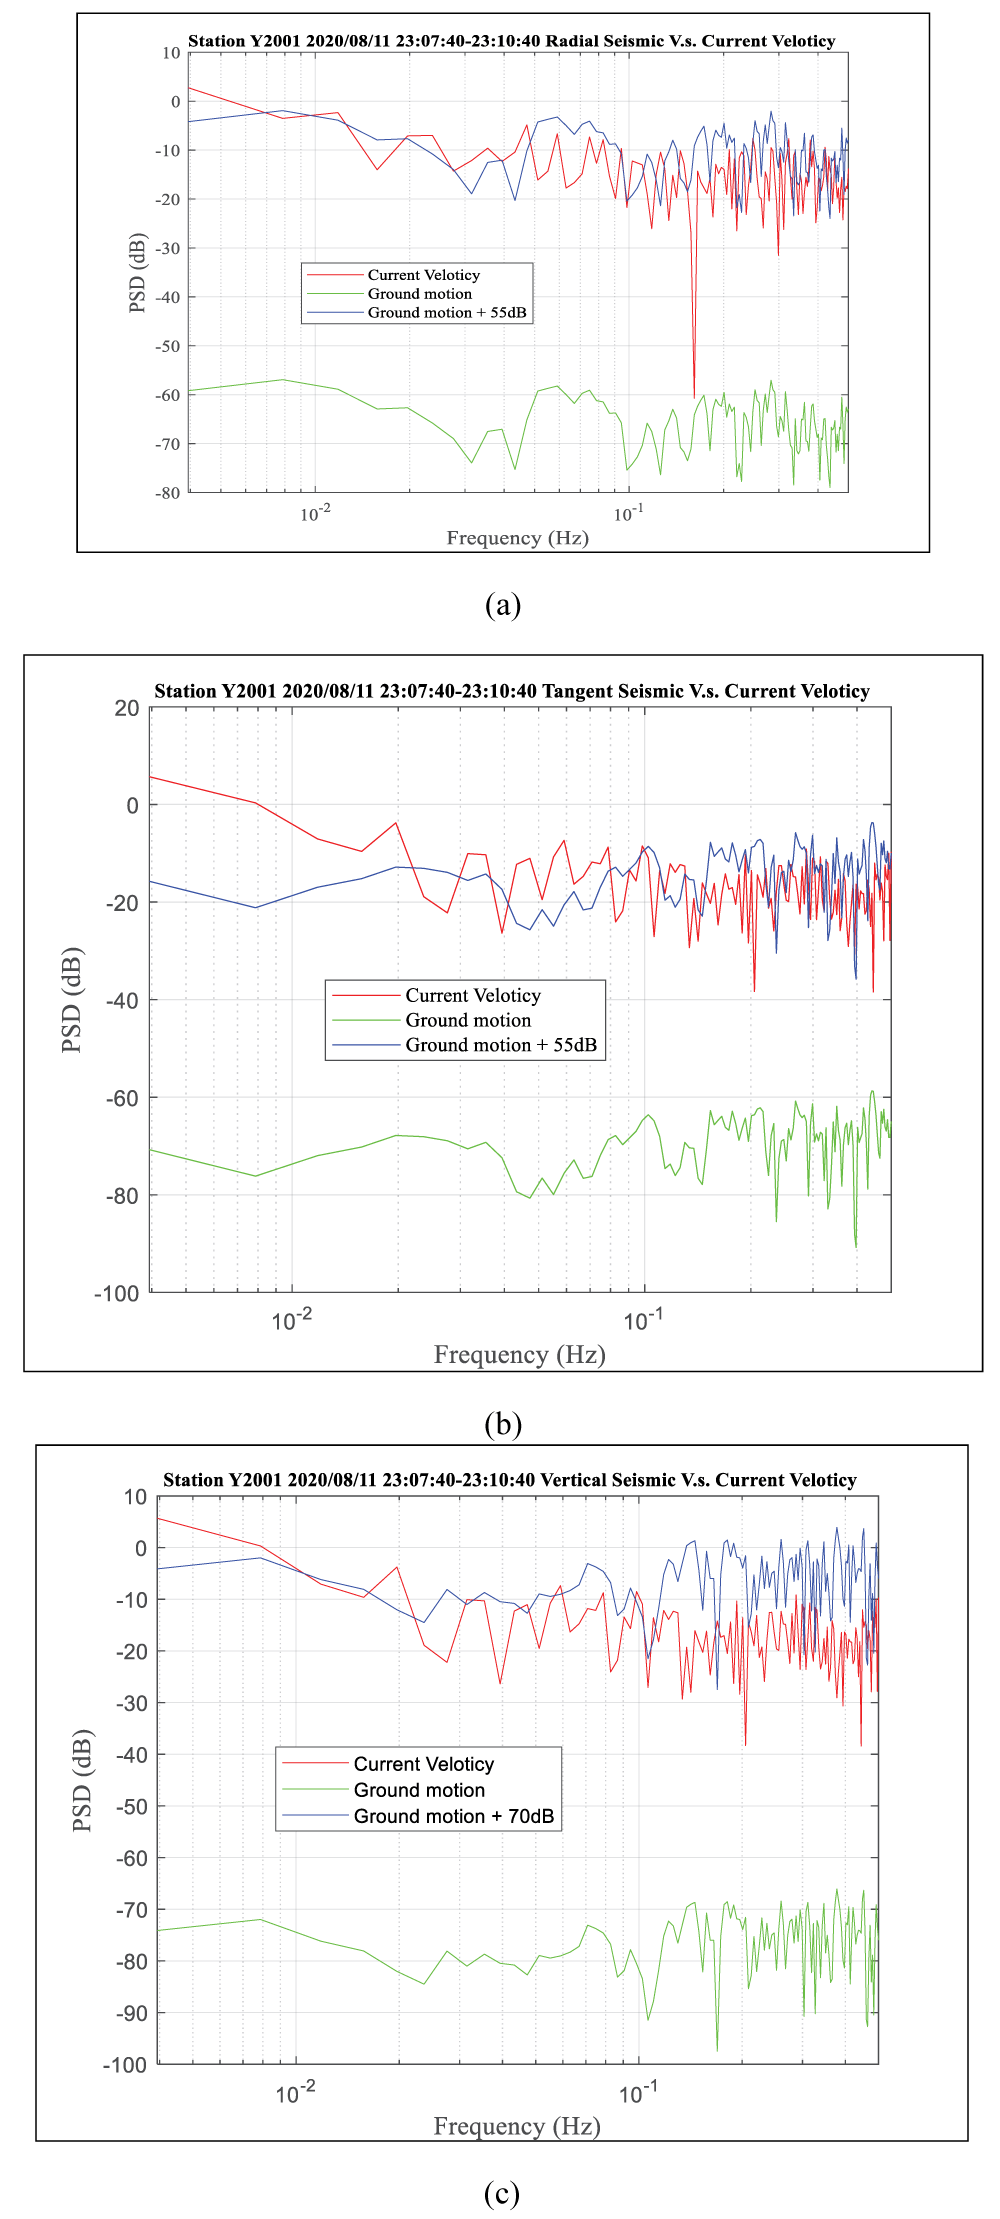
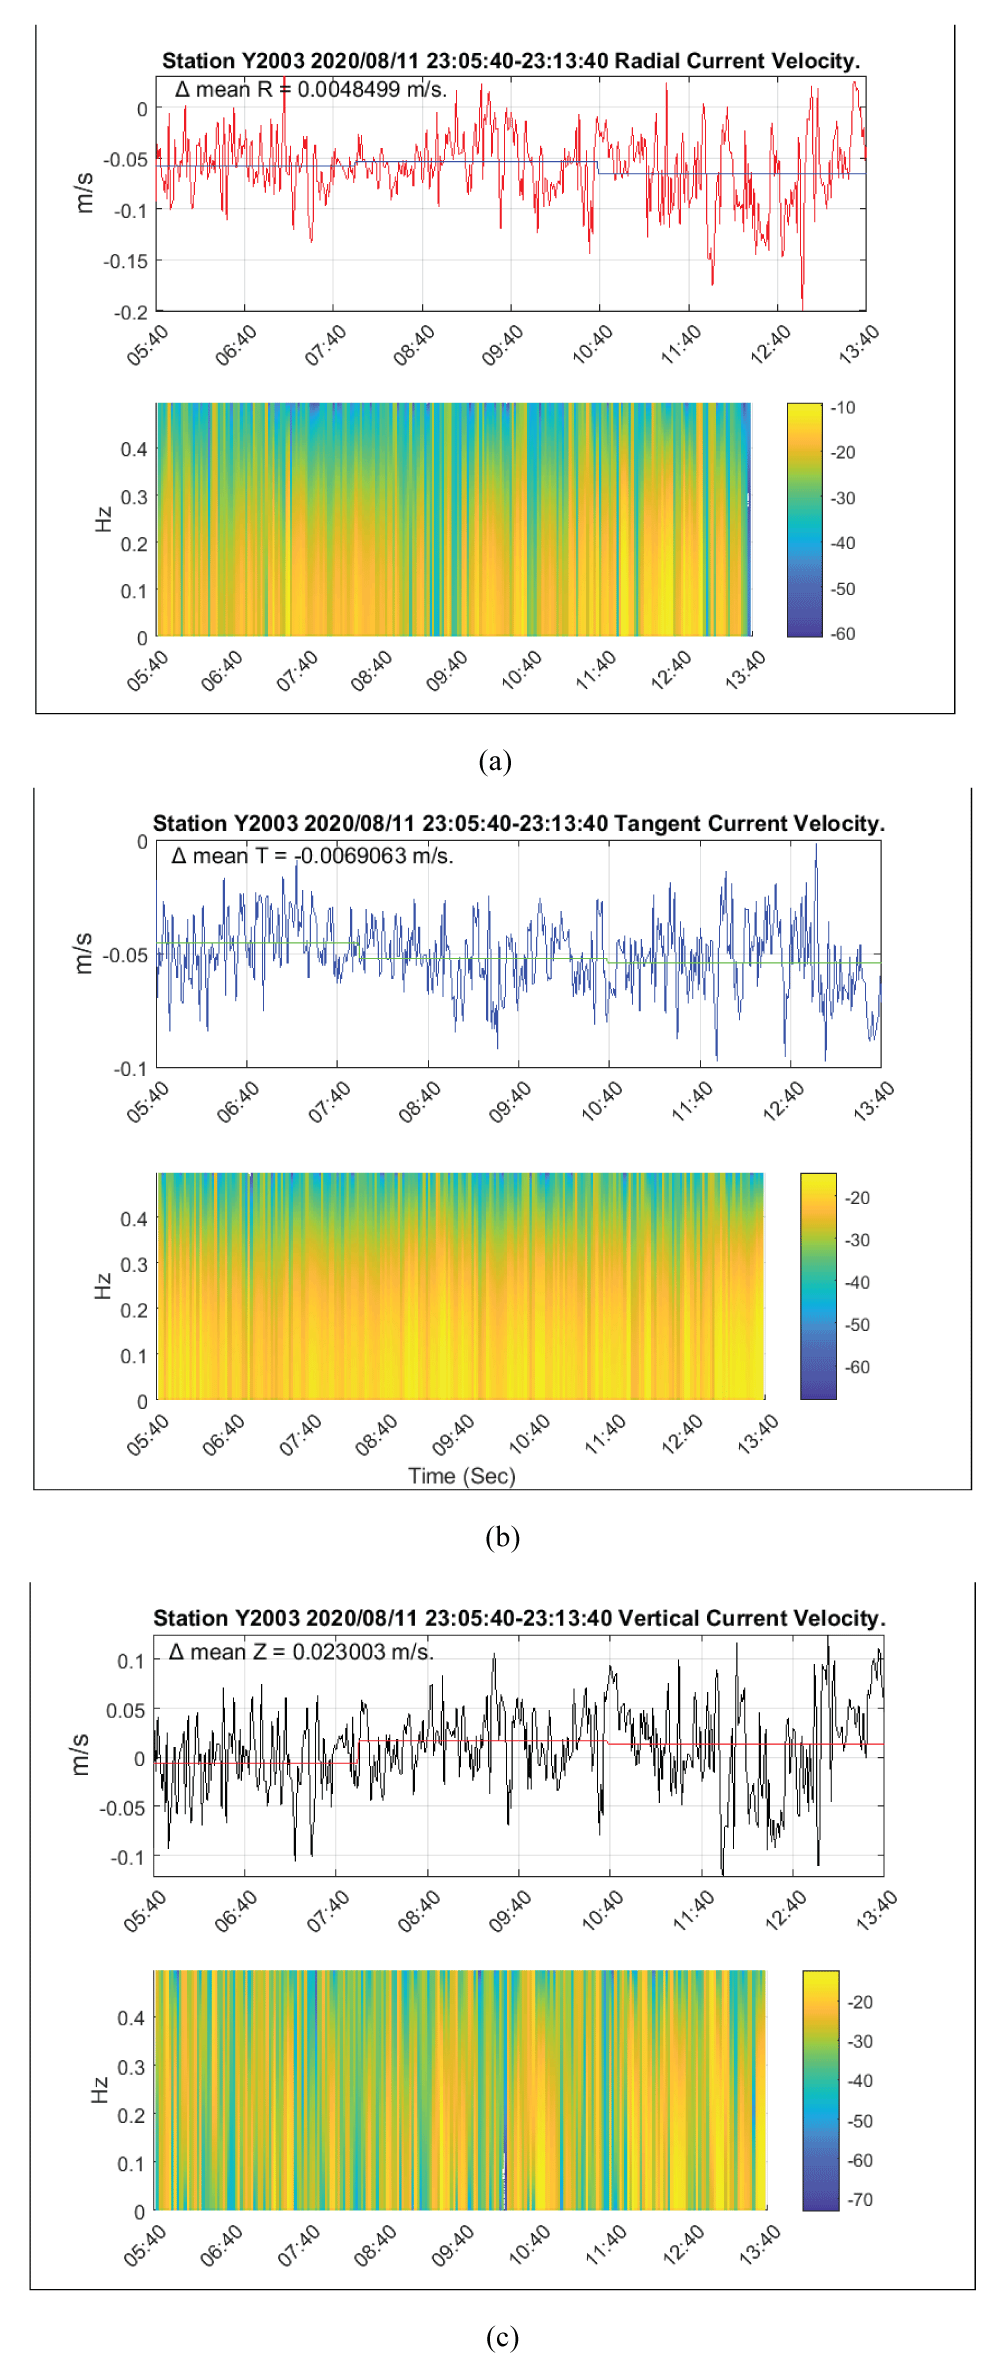
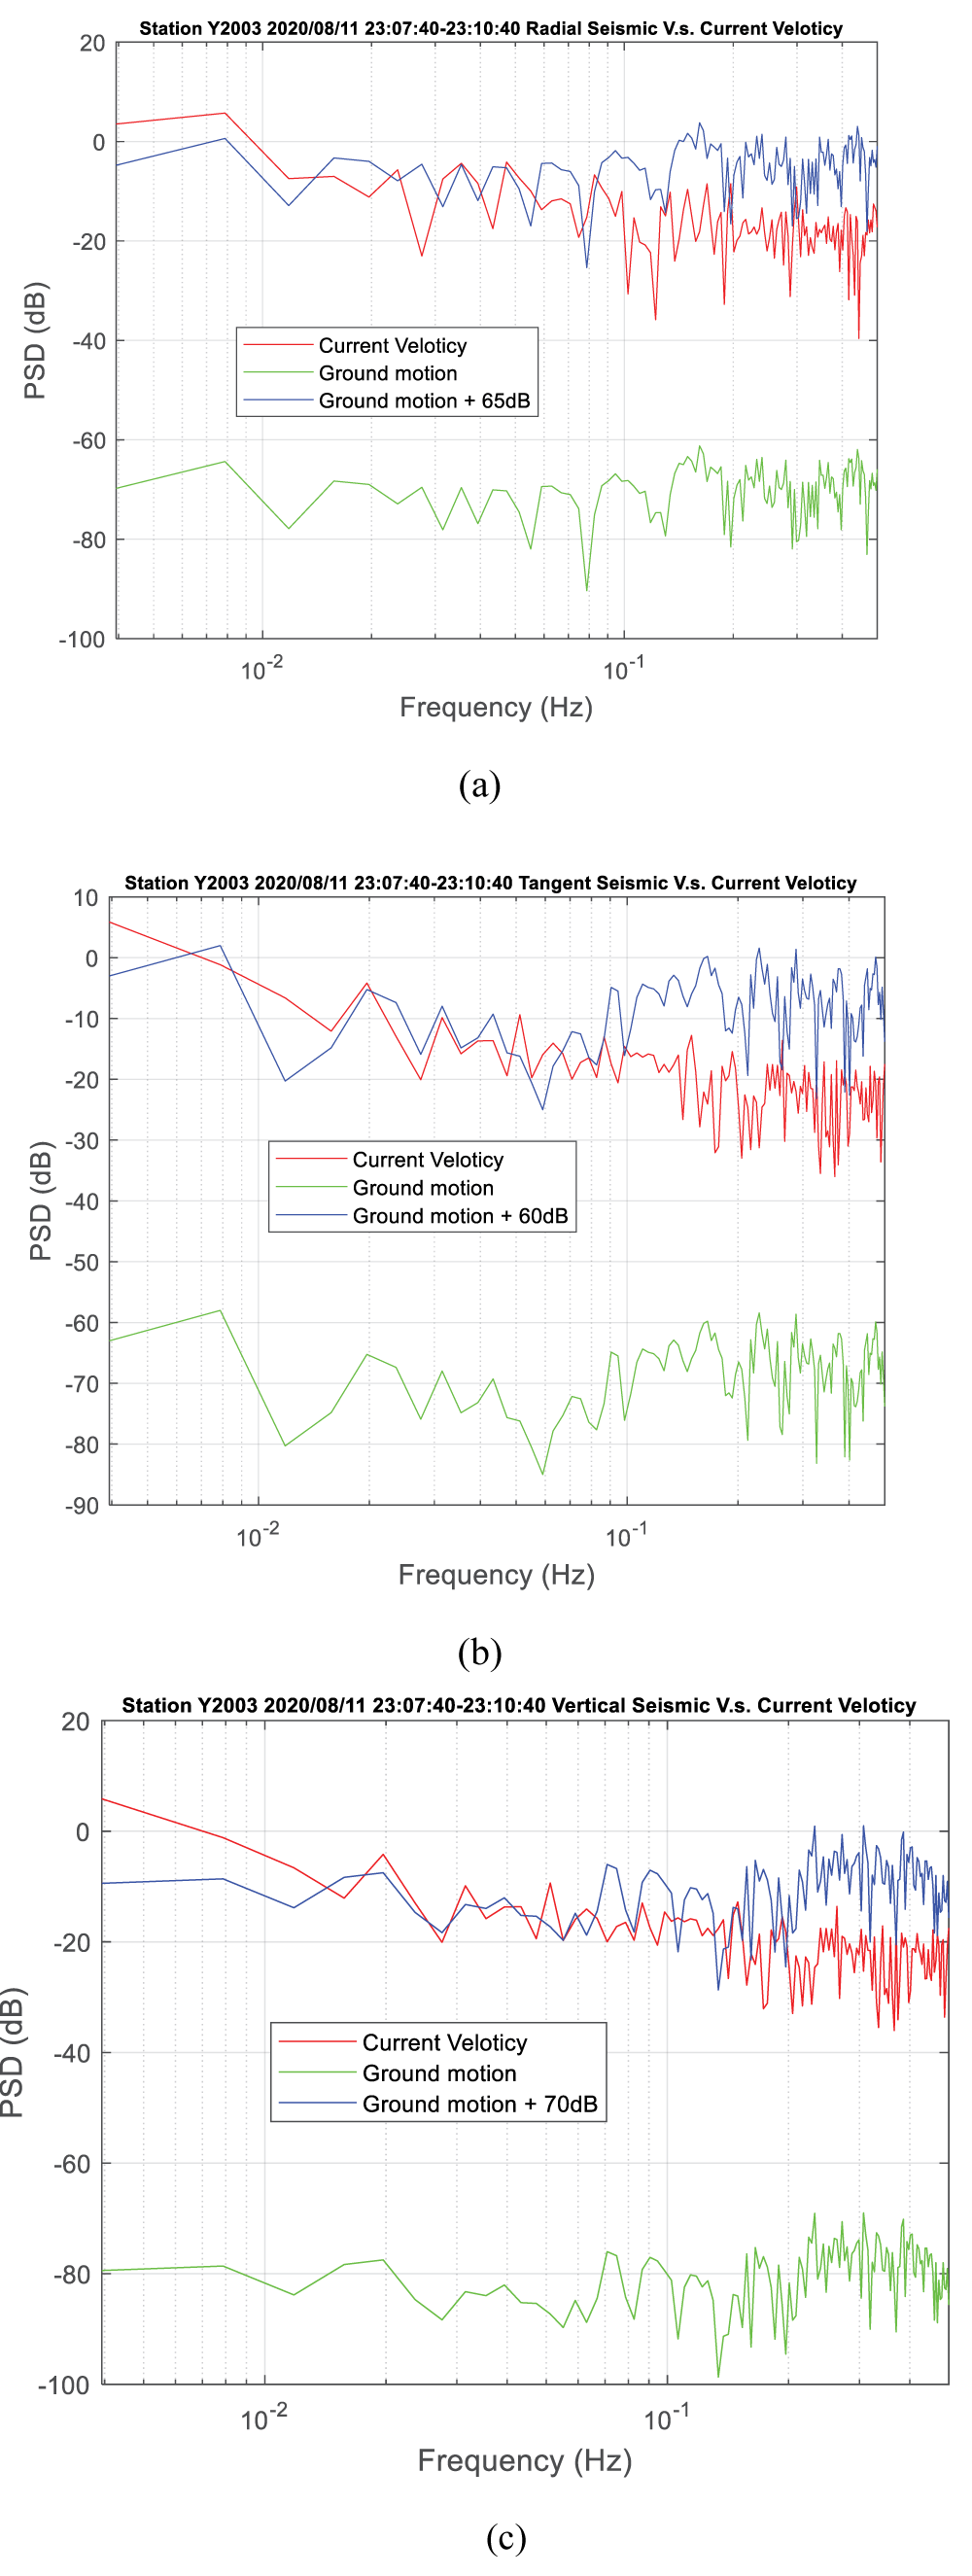
When the S-wave reaches the instrument, it typically induces a sudden lateral displacement at the surface where the instrument is located, and these displacements are particularly pronounced in the radial component. Due to the low viscosity of seawater, this results in variations in the water flow velocity at the seabed. During the deployment experiment in the Okinawa Trench from 2020/08/09 to 2020/09/28, only about 40 days of data were collected. During this period, no seismic events were found in the vicinity of the measurement station in the earthquake catalog, so we could only select local earthquakes with slightly larger amplitudes from the data. In this study, we chose the earthquake that occurred on 2020/08/11, at 23:07:40 for analysis. The maximum amplitudes recorded by station Y2001 and Y2003 for this earthquake were 0.006 m/s and 0.0019 m/s, respectively (Figure 14). From the time trace and spectrogram of current velocity at station Y2001 (Figure 15), it is observed that within 30 s of the arrival of the seismic S wave, the average water current velocity decreased by 0.010 m/s in the radial component (Figure 15a) and increased by 0.036 m/s in the vertical component (Figure 15c). The spectrogram also indicates intermittent decreases in water current velocity after the arrival of the S wave. No effect was observed in the tangential component (Figure 15b). The comparison of PSD values of seismic signals and current velocity at station Y2001 (Figure 16) reveals that after increasing the seismic signal by 55 - 75 dB, the tangent component below 0.015 Hz and the vertical component between 0.004 - 0.04 Hz exhibit similar amplitude characteristics. This indicates that seismic signals in the horizontal component with periods longer than 660 seconds and ground vibration signals in the vertical component with periods between 25 and 250 seconds will resonate with seabed current velocity. Applying the same analytical method to the data from station Y2003 (Figures 17,18), it is likely that the vibration amplitude of this earthquake was too small for this station to show a correlation between flow velocity and ground motion.
Offshore typhoon data analysis
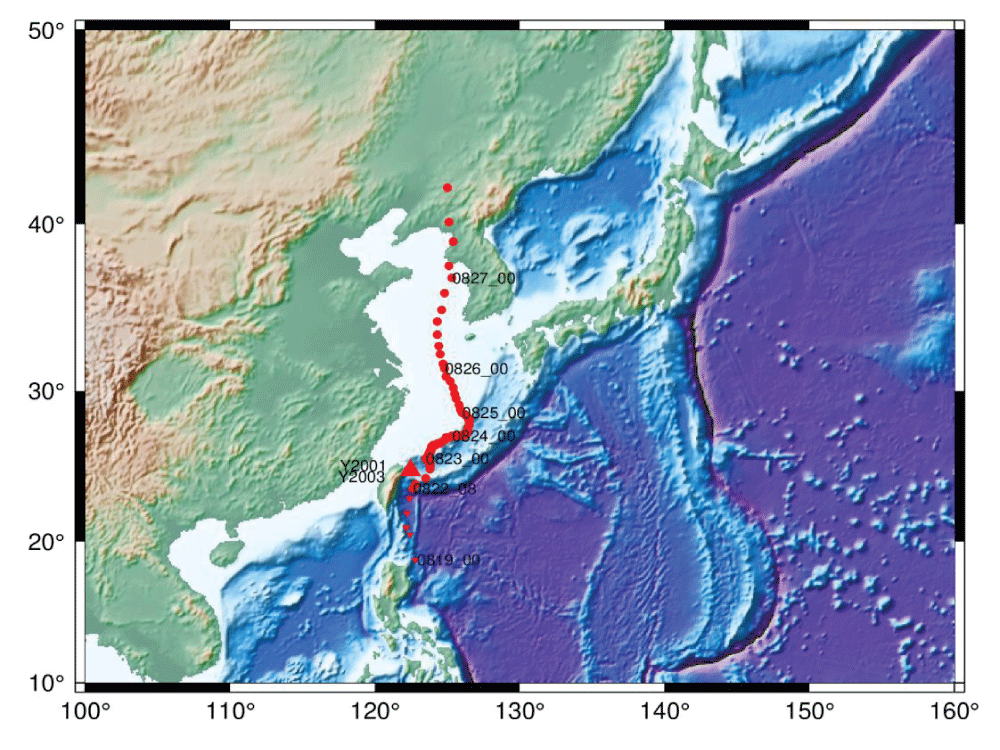
Typhoon No. 8 in 2020, named “Bavi,” formed as a tropical disturbance east of Luzon Island in the Philippines on 2020/08/17. By 2020/08/22, at 0:00 UT, the Japan Meteorological Agency officially upgraded it to a tropical storm and assigned the name “Bavi.” The typhoon moved almost northward from its formation as a tropical disturbance, and after approximately ten days, around 00:30 on 08/27, it made landfall along the coastal areas near the North Korea-China border. By around 02:00, Bavi weakened to a severe tropical storm. At 12:00, the China Meteorological Administration announced the cessation of its numbering. On the afternoon of 08/28, the Japan Meteorological Agency removed this weather system from the weather map. The typhoon’s path is depicted in Figure 19.
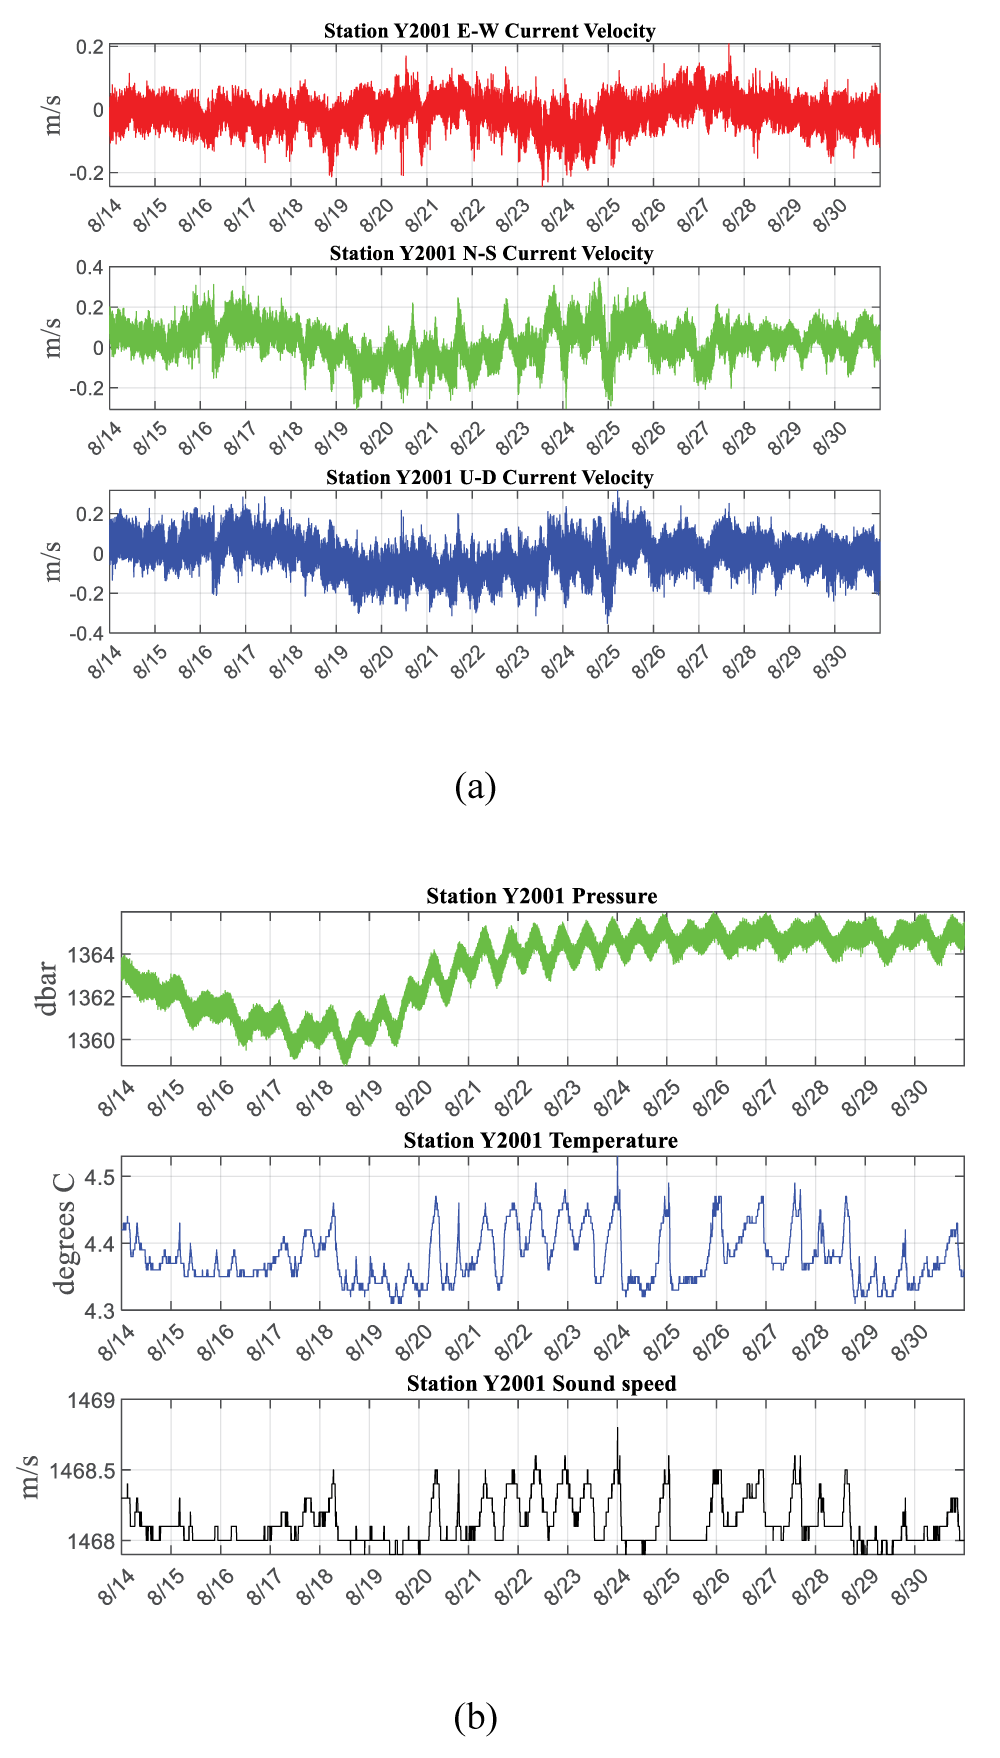
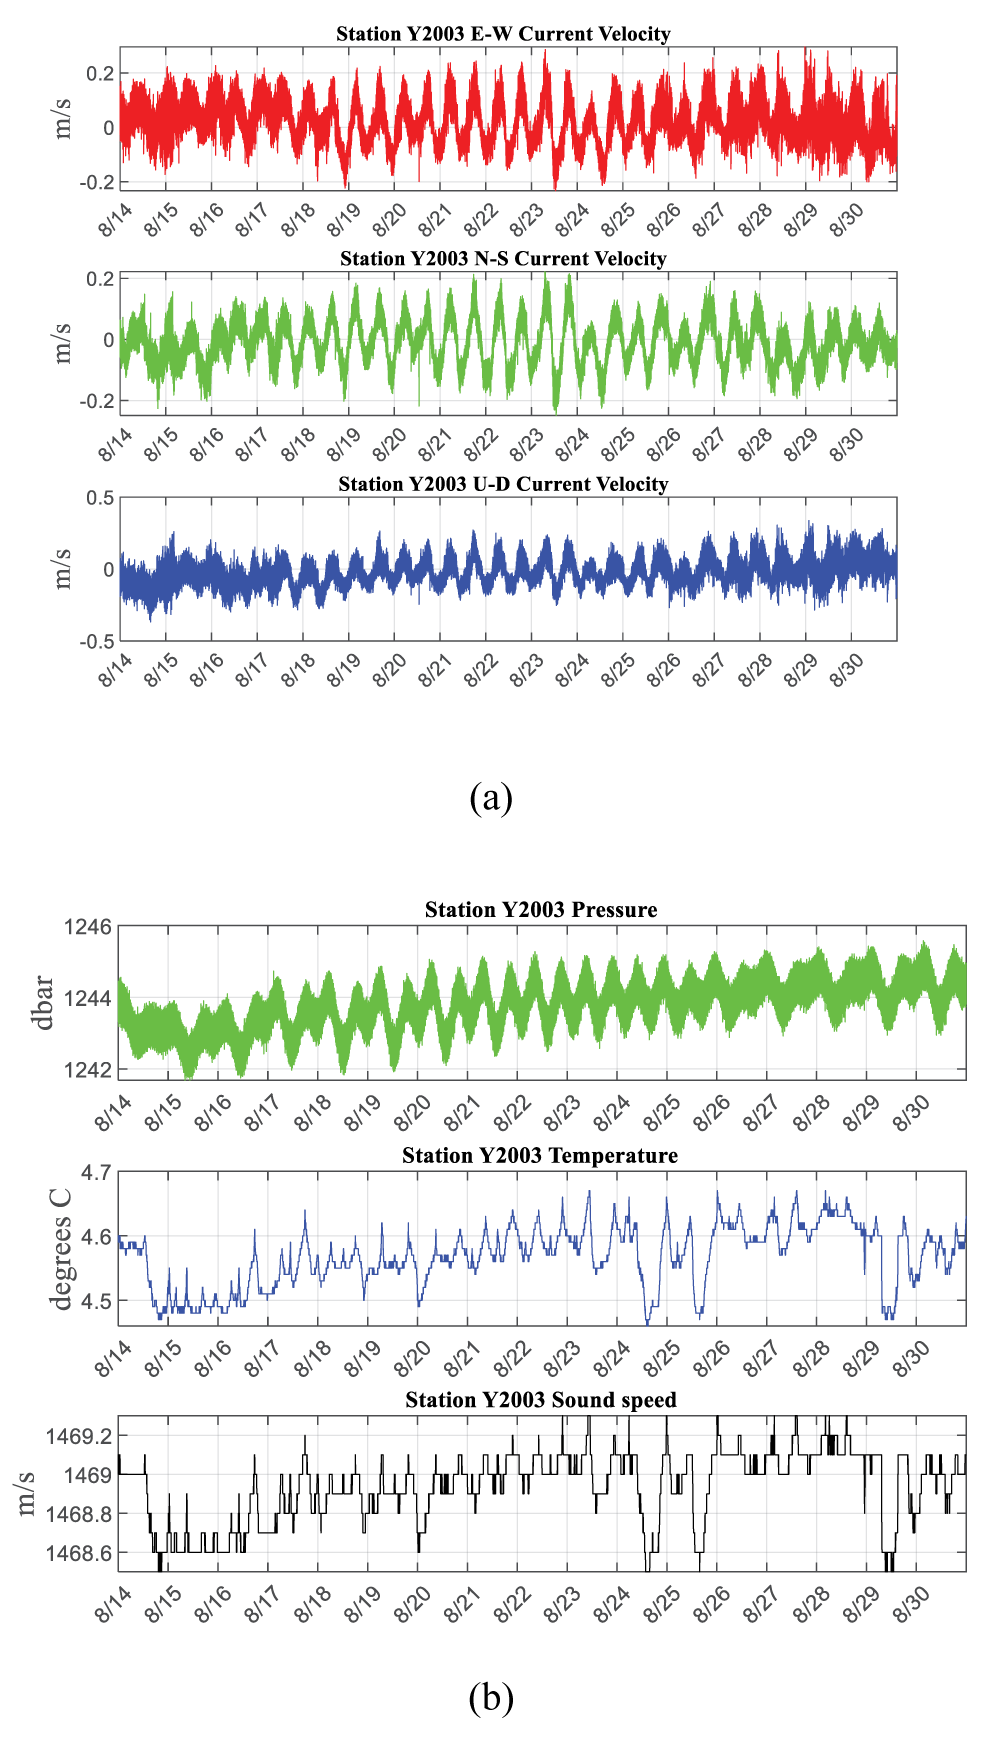
When a typhoon passes over the ocean, the momentum and heat exchange at the air-sea interface will cause dynamic and thermodynamic responses in the upper ocean [20]. Would it also affect the lower ocean? This study analyzes the records of the E-W, N-S, and U-D components of water velocity, water pressure, water temperature, and sound speed from 2020/8/14 0:00:00 (UT) to 8/30 23:59:59. This period covers the entire duration of Typhoon No. 8 from its formation to disappearance. According to the current velocity data from station Y2001 in Figure 20a, the N-S component was affected by the typhoon from 8/19 to 8/25 noon. The water pressure (Figure 20b) increased by 5 dbar starting from 8/19, and the disturbance period lasted from the formation of the typhoon tropical depression on 8/17 until the typhoon moved away on 8/26, resuming a one-day cycle. From 8/20 to 8/24, the water temperature changed from a daily cycle to two cycles per day, which also affected the surrounding sound speed. Figure 21 shows the records of water velocity, water flow amplitude, water temperature, sound speed, and water pressure at station Y2003 from 2020/8/16 0:00:00 (UT) to 8/27 23:59:59. According to the water velocity data, it was affected by the typhoon from 8/19 to 8/24 noon. From noon on 8/20 to noon on 8/23, the changes in water temperature and sound speed shifted from a daily cycle to two cycles per day. The disturbance period of water pressure lasted from 8/16 to 8/26.
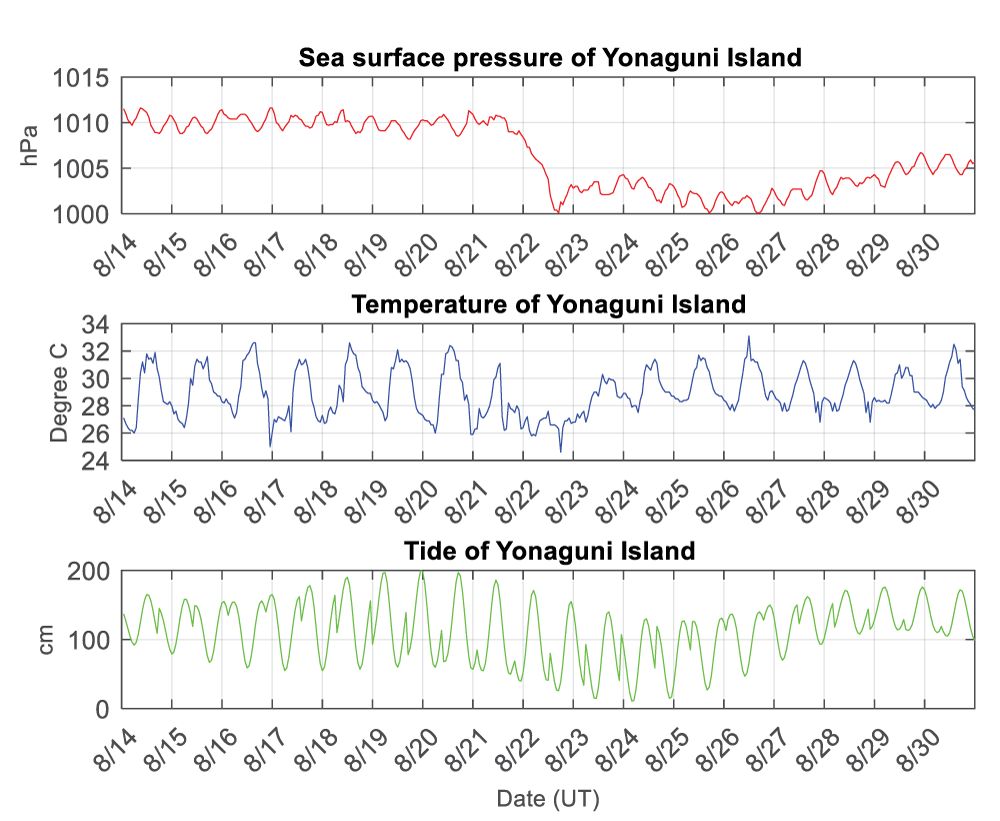
Comparing the seafloor current velocity (Figures 20,21) with the records of atmospheric pressure, temperature, and tides at the JMA Yonaguni Island station from 00:00:00 (UT) on 2020/8/14 to 23:59:59 on 8/30 (Figure 22), we observe that starting from 8/21, atmospheric pressure rapidly dropped by 10 hPa due to the influence of a typhoon, and it did not slowly rise until after 8/27. The temperature was affected between 08:00 on 8/21 and 12:00 on 8/23. The tidal variation increased from about 100 cm to 230 cm between 8/18 and 8/24. This data indicates that atmospheric pressure changes, even before a typhoon forms several thousand kilometers away, can cause small changes in seabed temperature, seabed flow velocity, and seawater pressure, which in turn affect ocean sound speed.
Discussion
The seafloor current velocity and seabed ground motion share similar frequency characteristics over long periods, but with differences in intensity. This suggests that ground vibration signals at certain periods can resonate with seabed water flow. However, more data analysis is needed to determine what magnitude of a local earthquake is required to cause resonance with current velocity. Observational data show that even when two identical instruments are placed about 5 nautical miles apart at similar seabed depths, the recorded temperature, flow velocity, and water pressure during a typhoon show differences. These discrepancies may be related to the seabed topography, seabed depth, and ocean current characteristics at the instrument locations. To further confirm these correlations, deploying more than five SCMs in a small area to form a cross-shaped observation array for data collection may help clarify these issues. Atmospheric pressure changes before a typhoon forms, even several thousand kilometers away, can affect small changes in seabed temperature, current velocity, and water pressure, which in turn influence ocean sound speed. It is worth considering whether these small changes also impact marine ecosystems. Before a typhoon forms, the low atmospheric pressure on the sea surface can affect the periodic variations in current velocity, water pressure, and temperature near the seabed. The path of Typhoon Bavi moved mostly northward, and it seems to have had a greater impact on the periodic variations in north-south seabed flow velocity. During the typhoon, the dominant frequency of current velocity variation decreases, while the dominant frequencies of water pressure and temperature increase, causing the dominant frequency of sound speed to rise as well.
Conclusion
This paper details the modification process of installing a current meter as an SCM and presents the results of data analysis from the marine environment. To observe the relationship between seabed currents and seismic activity, it is crucial to increase the sampling rate of observational data for sufficient resolution. However, increasing the sampling rate consumes more power and requires a larger memory capacity. Therefore, this paper describes how to calculate the necessary memory capacity and battery requirements during underwater deployment, and explains the instrument installation method, providing colleagues with similar experimental needs a reference basis.
Analysis of data over 4 hours without seismic events reveals from PSD results that in the horizontal component, after boosting seismic signals by 65 dB, seismic activity and water flow velocities exhibit similar frequency characteristics in the 3x10⁻³ – 2x10⁻² Hz range. Similarly, in the vertical component, after a 100 dB increase in seismic signals, seismic activity and water flow velocities show similar frequency characteristics in the 1x10⁻³ – 2x10⁻² Hz range. This suggests that seabed current velocities and seismic activity share similar frequency characteristics in long periods, albeit with differing intensities. It indicated that ground vibration signals at certain periods can resonate with seabed water flow.
For a seismic event with an amplitude of 0.006 m/s, the average water flow velocity decreased by 0.010 m/s in the radial component and increased by 0.036 m/s in the vertical component within 30 s of the arrival of S-waves. Spectrogram analysis indicates intermittent decreases in current velocity after the arrival of S-waves. This phenomenon occurs because seawater has low viscosity, so when S-waves reach the surface where the instrument is located and cause instantaneous lateral displacement, it results in changes in seabed current velocity.
Comparing PSD values of seismic signals with current velocities (Figure 16) reveals that after increasing seismic signal amplitudes by 55 - 75 dB, the tangent component below 0.015 Hz and the vertical component between 0.004 - 0.04 Hz exhibit similar amplitude characteristics. However, this event caused a maximum amplitude of only 0.0019 m/s at Y2003z, possibly too small to clearly show the relationship between current velocity and seismic activity.
The storm range of Typhoon “Bavi” in August 2020 covered the area where SCMs were deployed. Analysis from the data indicates that atmospheric pressure variations preceding the formation of typhoons thousands of kilometers away affect minor changes in seabed temperature, seabed flow velocities, and seawater pressure, subsequently influencing oceanic sound speed. Island air temperatures and sea surface temperatures, however, are affected primarily by rainfall.
Author contributions
Conceptualization, resources, project administration, funding acquisition, methodology, software, validation, formal analysis, investigation, data correction, writing—original draft preparation, editing, visualization by Ching-Ren Lin.
Funding
This research has been supported by IESAS and the NSTC, TAIWAN (grant No: 108-2116-M-001-012, 109-2116-M-001-026, 110-2116-M-001-021, 112-2116-M-001-019 and 113-2116-M-001-011).
Data availability statement
The data used in the paper can be accessed by contacting the author.
- Gould J, Sloyan B, Visbeck M. In situ ocean observations: a brief history, present status, and future directions. In: Siedler G, Griffies S, Gould J, Church J, editors. Ocean circulation and climate: a 21st century perspective. 2nd ed. Oxford, GB: Academic Press; 2013;59-82. Available from: https://eprints.soton.ac.uk/358924/
- Neill SP, Hashemi MR. In situ and remote methods for resource characterization. In: Fundamentals of ocean renewable energy: generating electricity from the sea. E-Business Solutions; 2018;157-191. Available from: http://dx.doi.org/10.1016/B978-0-12-810448-4.00007-0
- Chang MH, Cheng YH, Yeh YY, Yang YJ, Jan S, Liu CL, et al. Internal hydraulic transition and turbulent mixing observed in the Kuroshio over the I-Lan Ridge off northeastern Taiwan. J Phys Oceanogr. 2022;52(12):3179-3319. Available from: https://doi.org/10.1175/JPO-D-21-0245.1
- Sinnett G, Ramp SR, Yang YJ, Chang MH, Jan S, Davis KA. Large-amplitude internal wave transformation into shallow water. J Phys Oceanogr. 2022;52(10):2539-2554. Available from: https://doi.org/10.1175/JPO-D-21-0273.1
- Jan S, Chang MH, Yang YJ, Sui CH, Cheng YH, Yeh YY, Lee CW. Mooring observed intraseasonal oscillations in the central South China Sea during the summer monsoon season. Sci Rep. 2021;11:13685. Available from: https://www.nature.com/articles/s41598-021-93219-3
- Worcester PF, Dzieciuch MA, Mercer JA, Andrew RK, Dushaw BD, Baggeroer AB, et al. The North Pacific Acoustic Laboratory deep-water acoustic propagation experiments in the Philippine Sea. J Acoust Soc Am. 2013;134:3359-3375. Available from: https://doi.org/10.1121/1.4818887
- Zhang X, Luan Z, Du Z, Xi S, Li L, Lian C, Zhang J, Yin Z, Ma L, Zhang X. Gas hydrates in shallow sediments as capacitors for cold seep ecosystems: insights from in-situ experiments. Earth Planet Sci Lett. 2023;624:118469. Available from: https://doi.org/10.1016/j.epsl.2023.118469
- Schmidt W, Siegel E. Voyage to the bottom of the Puerto Rico Trench: tales from a free fall current meter. In: IEEE/OES 10th Current, Waves and Turbulence Measurements (CWTM); Monterey, CA, USA; 2011;115-22. Available from: https://ieeexplore.ieee.org/document/5759538
- Du Z, Zhang X, Lian C, Luan Z, Xi S, Li L, et al. The development and applications of a controllable lander for in-situ, long-term observation of deep-sea chemosynthetic communities. Deep Sea Res I Oceanogr Res Pap. 2023;193:103960. Available from: https://doi.org/10.1016/j.dsr.2022.103960
- Zhang B, Su M, Chen H, Liu F, Zheng W, Su P, et al. How do fault systems and seafloor bathymetry influence the structure and distribution characteristics of gas chimneys? Basin Res. 2023;35(5):1718-1743. Available from: https://doi.org/10.1111/bre.12770
- Yahel G, Yahel R, Katz T, Lazar B, Heru B, Tunnicliffe V. Fish activity: a major mechanism for sediment resuspension and organic matter remineralization in coastal marine sediments. Mar Ecol Prog Ser. 2008;372:195-209. Available from: https://www.int-res.com/abstracts/meps/v372/p195-209/
- Mueller P, Thoss H, Kaempf L, Güntner A. A buoy for continuous monitoring of suspended sediment dynamics. Sensors. 2013;13:13779-13801. Available from:https://doi.org/10.3390/s131013779
- Lin CR, Liao YC, Wang CC, Kuo BY, Chen HH, Jang JP, Chen PC, Chang HK, Lin FS, Chang KH. Development and evaluations of the broadband ocean bottom seismometer (Yardbird-BB OBS) in Taiwan. Terr Atmos Ocean Sci. 2024;35(4). Available from: https://link.springer.com/article/10.1007/s44195-024-00062-w
- McNamara DE, Boaz RI. Seismic noise analysis system using power spectral density probability density functions: a stand-alone software package. Open-File Report 2005-1438. U.S. Geological Survey; 2006. Available from: https://pubs.usgs.gov/of/2005/1438/pdf/OFR-1438.pdf
- Peterson J. Observation and modeling of seismic background noise. U.S. Geol Surv Tech Rept. 1993;93-322:1-95. Available from: https://doi.org/10.3133/ofr93322
- Bruserud K, Haver S. Uncertainties in current measurements in the northern North Sea. J Atmos Oceanic Technol. 2017;34(4):855-76. Available from: https://doi.org/10.1175/JTECH-D-16-0192.1
- Lin CR, Kuo BY, Liang WT, Chi WC, Huang YC, Collins J, Wang CY. Ambient noise and teleseismic signals recorded by ocean-bottom seismometers offshore eastern Taiwan. Terr Atmos Oceanic Sci. 2010;21:743-55. Available from: http://dx.doi.org/10.3319/TAO.2009.09.14.01(T)
- Kuo BY, Wang CC, Lin SC, Lin CR, Chen PC, Jang JP, Chang HK. Shear-wave splitting at the edge of the Ryukyu subduction zone. Earth Planet Sci Lett. 2012;355-356:262-270. Available from: https://doi.org/10.1016/j.epsl.2012.08.005
- Ko YT, Kuo BY, Wang KL, Lin SC, Hung SH. The southwestern edge of the Ryukyu subduction zone: a high Q mantle wedge. Earth Planet Sci Lett. 2012;336:145-153. Available from: https://doi.org/10.1016/j.epsl.2012.04.041
- Gong Q, Wang Q, Chen L, Diao Y, Xiong X, Sun J, Lv X. Observation of near-inertial waves in the wake of four typhoons in the northern South China Sea. Sci Rep. 2023;13:3147. Available from: https://www.nature.com/articles/s41598-023-29377-3
Article Alerts
Subscribe to our articles alerts and stay tuned.
 This work is licensed under a Creative Commons Attribution 4.0 International License.


 Save to Mendeley
